Deploy Applications in Kubernetes
This is the second part of the kubernetes(k8s) series where we will focus on deploying three applications inside a k8s cluster namely a Postgres database, a Go API server, and a Nuxt frontend single-page-application (SPA).
Along the way, we will learn about typical k8s objects including Deployment, Service, PersistentVolume, Secret, but also related stuff like port-forwarding, authorization, building container images, and many others. Just like the first part, this post is also going to be elaborate containing many details because k8s is a behemoth, and I think it is a good idea to look a little bit under the hood to get a better understanding of how all the pieces work together. What we will do is to simply break it down into smaller parts, and you will see that using a handful of yaml files were enough to easily deploy applications on k8s.
Circling back to the applications, we are going to deploy three items:
-
A frontend written in Nuxt 3 that you will see and interact with
-
A database using Postgres that will store our data
-
A backend api server written in Go
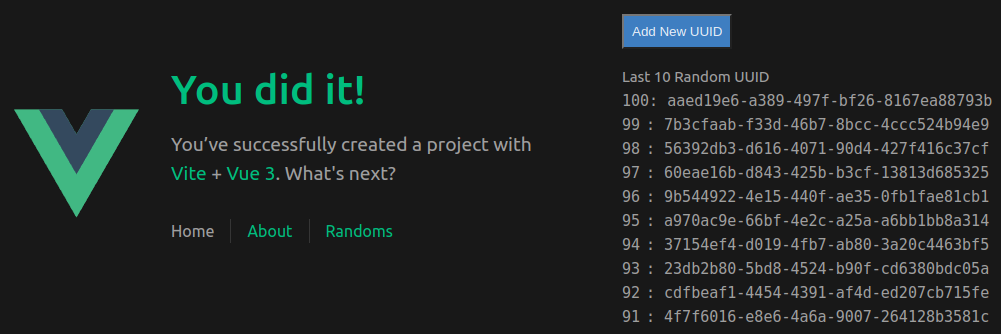
The frontend will be a simple interface where it will list the latest ten UUID items which are stored from a database. We will add an ‘add’ button where a new random UUID is generated and stored into the database. Once that is done, it will do another api call to retrieve the latest UUIDs.
This is what it’ll look like
 Figure 1: Demonstration of the final product
Since all three applications are going to live inside k8s, we need a way to access them. To expose the applications, we will port-forward a couple of applications to our local computer. Firstly, the frontend needs to be port-forwarded so that we can access it using the browser from local the computer. The frontend needs access to the api, so we will port-forward that too. Database does not need to be port forwarded because it is only going to interact with the api within the cluster. There is an important step regarding the address we need to use for api to access the database which we will see later.
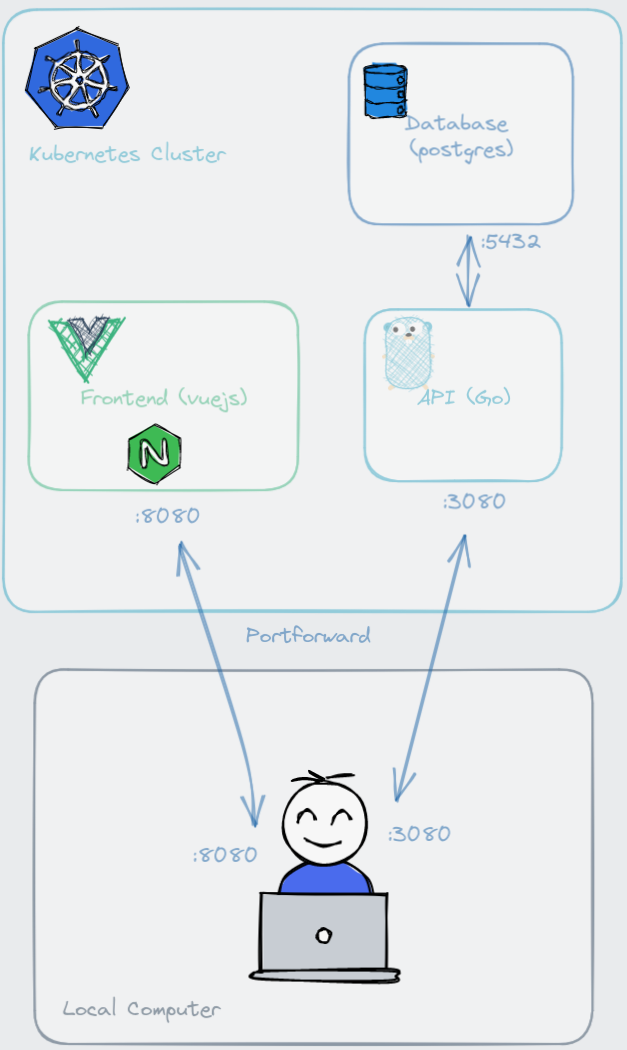 Figure 2: Overall architecture of the applications
Finally, the backend api server acts as an intermediary between the frontend and the database. Although its purpose is simple, we need to think about from where will this api read configuration settings. When deploying a new update to the api, we want to ensure in-progress requests not be cancelled out, so we need a graceful way of shutting down the program. By extension, k8s needs to know if the api is running, otherwise it needs to route incoming requests to another Pod. If there are any database schema changes, that needs to be applied as well. As you can see, there are many things need to be considered and for that, some principles of 12-factor apps are going to be applied. Lots of questions need to answered, and we will look at designing such application.
~~
To follow along this post, these are the three repositories you may clone and play with. Devops repo is intentionally separate from api and web with the idea that cluster admin manages k8s side and database, while full-stack developers only concern with api and frontend. This blog post will assume you are part of a devops team. Sections with a fullstack engineer role will be made known in the code block commented with ### Run by user dev007..
- K8s administration: https://github.com/gmhafiz/k8s-devops (includes database deployment)
- Api: https://github.com/gmhafiz/k8s-api
- Web: https://github.com/gmhafiz/k8s-web
This is part of a series of blog posts including:
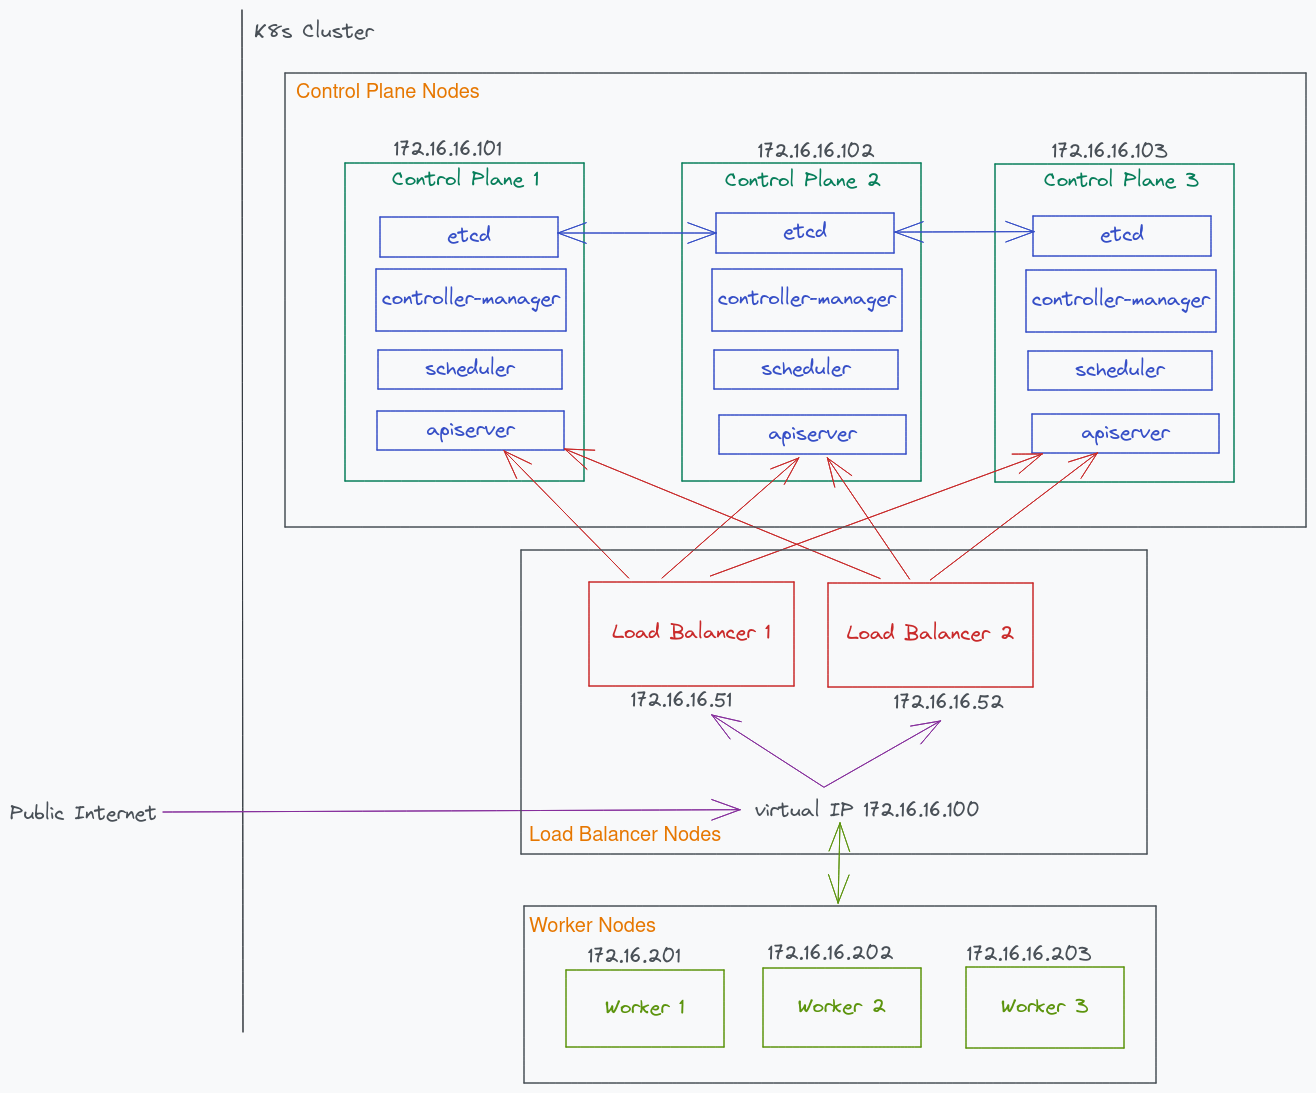
- Part 1: Highly Available Kubernetes Cluster - with vagrant and libvirt
- Part 2: Deploy Complex Web App - Create a Vue3 frontend, Go API, one postgres database
-
Part 3: (Coming!) Ingress Controller - Backup and Restore
etcd, access local k8s cluster from the internet
Table of Contents
Prerequisite
A working k8s cluster: see see part 1, k3s, kind, minikube, etc.
Database
We need a database that can persist our random UUID data so our api can access and store them. For that, let us deploy a postgres database in the k8s cluster. There are several k8s objects we require for this setup. We will see that k8s tends to use the terms ‘object’ and ‘resource’ interchangeably, as will I. First up is configuration.
Configuration
Before creating a database, we need to set credentials as variables such as username, password, and database name. There are various ways to do this but the simplest is to simply set them as environment variables — some might argue this is a best practice. Anyhow, let us look at a first approach, which is a ConfigMap.
The following is a k8s object called ConfigMap named as ‘db-credentials’. This is the name to identify this particular ConfigMap object. You will see a lot of yaml files from now on. These files are written in a declarative way that states what we want the final picture to look like — we declare that we are setting my_db as the database name, etc…
# /k8s-devops/db/configmap.yaml

apiVersion: v1
kind: ConfigMap
metadata:
  name: db-credentials
  labels:
    app: postgresdb
data:
  POSTGRES_DB: "my_db"
  POSTGRES_USER: "user"
  POSTGRES_PASSWORD: "Password" # sensitive information should not be left unencrypted!
  PGDATA: "/var/lib/postgresql/data"
As you can see there is a glaring issue with this because the database password is in plain sight so this file cannot be committed to a public repository.
We can use another k8s object called Secret. Any sensitive data including passwords, a token, or a key can be stored in this Secret object. So we remove POSTGRES_PASSWORD from ConfigMap, and we use a Secret object instead as follows:
# /k8s-devops/db/secrets.yaml

apiVersion: v1
kind: Secret
type: Opaque
metadata:
  name: postgres-secret-config
data:
  POSTGRES_PASSWORD: UGFzc3dvcmQ=
This looks much better because now you do not see the sensitive data in plain sight. However, the value is actually a base64 encoded password using echo -n "Password" | base64 command. That means, anyone with access to the cluster with the right authorization will be able to decode the string. Try it using the following commands:
kubectl edit secret postgres-secret-config
returns
# Please edit the object below. Lines beginning with a '#' will be ignored,
# and an empty file will abort the edit. If an error occurs while saving this file will be
# reopened with the relevant failures.
#
apiVersion: v1
data:
  POSTGRES_PASSWORD: UGFzc3dvcmQ=
kind: Secret
type: Opaque
metadata:
  creationTimestamp: "2023-07-02T06:58:48Z"
  name: postgres-secret-config
namespace: default
...
and
echo 'UGFzc3dvcmQ=' | base64 --decode

# returns
Password
Clearly this approach is unacceptable because not only is the password accessible within the cluster, but we cannot commit this to a public source control repository as any person with access to this repository will be able to read the password. Fortunately, this is not the end of the road. We can still salvage this situation by taking a step further by encrypting this Secret object by using a third party tool called SealedSecrets from Bitnami. Like many cases, you often have other choices. They are Vault from Hashicorp, and sops from Mozilla. To do this, we need to install its controller to our k8s cluster, and we need its accompanying cli called kubeseal.
Sealed Secrets
Install kubeseal to /usr/local/bin/kubeseal.
mkdir -p ~/Downloads/kubeseal
cd ~/Downloads/kubeseal
wget https://github.com/bitnami-labs/sealed-secrets/releases/download/v0.22.0/kubeseal-0.22.0-darwin-amd64.tar.gz
tar -xvzf kubeseal-0.22.0-darwin-amd64.tar.gz
sudo install -m 755 kubeseal /usr/local/bin/kubeseal
Install SealedSecret controller by applying this controller.yaml file.
kubectl apply -f https://github.com/bitnami-labs/sealed-secrets/releases/download/v0.22.0/controller.yaml
Now we have everything we need (cli, controller, and Secret object) to create a SealedSecret object. We choose to install this SealedSecret controller to the default cluster controller which is kube-system. Format can be either json or yaml. We choose yaml to be consistent with other files.
cat secrets.yaml | kubeseal \
--controller-namespace kube-system \
--controller-name sealed-secrets-controller \
--format yaml \
> sealed-secrets.yaml
Kubeseal uses a public key from this controller to encrypt the data. It can only be decrypted by the cluster because only this cluster has access to public key’s corresponding private key.
Result is as follows.
# /k8s-devops/db/sealed-secrets.yaml

apiVersion: bitnami.com/v1alpha1
kind: SealedSecret
metadata:
  creationTimestamp: null
  name: postgres-secret-config
  namespace: default
spec:
  encryptedData:
    POSTGRES_PASSWORD: AgCAJxd4LMUD9O18E5ytJ07a6IHuaDqeIDCi0GfByXQykSV+2zvK2e0xApIft6kjPHlEelmMerfSA2INDWLniFq/PKIvjwIcy7a5s1EVNLpzSK1VHzdSJBDunnOCIqxSL1G18+py4gtLrBYwhBrl+yCrArqPG3HjFwytP7uyH1wuymWKKcWIVR41WO8yyC5le9guAwdRIG2ltKft3d2w64ayRpEW0JNrgeLktlS4wvsAgPKFvU2SqKBLMK2eShFoEmbng35xqo9Zu98nzq/iDocExfjAxWUlVDm6O2d42WKKOyrVZ8uNeZvgHlWA7NkfFucOVeI4QrEc7duKB5sYTG8ipDOT3u6r9iTCbw4lQG9JRlWqKnJWq9Wk7pwrSWOklBBxj+sYAPh6BPL4fDm9PXjKfkSbt0x5qIz9KfRYQmmslKtH7ym+WXQAx1H/Ba91k5e5Eh+2437nqbJZYNmqdfV0U5xodOdgC5gKZc4+yr9shmj24FaPo8tmJupDiO8+4014Q0rjJx78b/bahJWw0BzrgWO/xD2HlyeboJXMi4cch0IrIbSei3V6UaIUd61ybIJkyJKiY6QQesR0pCQQcOP1wLxEz3cMZBY0PxAzpaRVDqRlCxBLcxD8sVZYxTl0R0G9exhBUyl9hsPYPP6Zvnw+2DlIddnuRID5ryfpleh+7K4GU4JHVpSBrEFuEuzWhP/v0KfkVOMkVsG2VQ==
  template:
    metadata:
      creationTimestamp: null
      name: postgres-secret-config
      namespace: default
Looking food so far. The value of .spec.encryptedData.POSTGRES_PASSWORD is now encrypted. Let us apply this Secret along with our ConfigMap.
kubectl apply -f configmap.yaml
kubectl apply -f sealed-secrets.yaml
If you inspect this Secret, you will be able to see POSTGRES_PASSWORD’s base64 encoded value in plain sight. Anyone who can access your cluster with the right permission can still view the password with the following command.
kubectl edit secret postgres-secret-config
returns…
# Please edit the object below. Lines beginning with a '#' will be ignored,
# and an empty file will abort the edit. If an error occurs while saving this file will be
# reopened with the relevant failures.
#
apiVersion: v1
data:
  POSTGRES_PASSWORD: UGFzc3dvcmQ=
kind: Secret
type: Opaque
metadata:
  creationTimestamp: "2023-07-02T06:58:48Z"
  name: postgres-secret-config
  namespace: default
  ...
… and we get its base64 encoded string. Are we back to square one? Let us say that the devops (you) is not the only person who can access this cluster. You might allow a developer to also access this cluster so that they can deploy their api. However, you may not want to expose the database password to them. If that is the case, you may choose an authorization system like RBAC to restrict access.
Remember that our api server itself will get access to the database password because otherwise, the api cannot talk and to it and store data! Since the Secret object cannot be accessed by developers, one thing they can try is to sneak in a code that reads the password to be sent elsewhere — if code review did not manage to flag that of course! If it is okay for the developer to know the production database password, none of this matters and SealedSecret is sufficient, and you can let the developer access the cluster normally.
In conclusion, you need to create a threat model assessment before deciding on what to do. There are a lot more details about this threat model process so whatever security decisions you want to make, it needs to be done properly.
Volumes
We need to create a storage space for the database to store data. We will create two objects which are PersistentVolume (PV), and PersistentVolumeClaim (PVC). PersistentVolume is how we create a ‘space’ for the data to live. PersistentVolumeClaim on the other hand is how we request a portion of space from that PersistentVolume. We will only create 5Gi which is more than enough for our purpose. hostPath uses /mnt/data directory in one of the nodes to emulate network-attached storage. This is a bad idea to use in production because if you lose this node, all data will be gone. For production setup, use a proper external storage like EBS or NFS. More details in kubernetes’ PV documentation.
# /k8s-devops/db/pv.yaml

apiVersion: v1
kind: PersistentVolume
metadata:
  name: postgres-pv-volume
  labels:
    type: local
spec:
  storageClassName: manual
  capacity:
    storage: 5Gi
  accessModes:
    - ReadWriteMany
  hostPath:
    path: "/mnt/data"
Next we claim that much space using PersistentVolumeClaim. Claiming 5Gi means we have exhausted all available storage.
# /k8s-devops/db/pvc.yaml

apiVersion: v1
kind: PersistentVolumeClaim
metadata:
  name: postgres-pv-claim
spec:
  storageClassName: manual
  accessModes:
    - ReadWriteMany
  resources:
    requests:
      storage: 5Gi
Note the PersistentVolumeClaim name, ‘postgres-pv-claim’, is important for our next object which is Deployment to refer to.
Apply with
kubectl apply -f pv.yaml
kubectl get pv postgres-pv-volume

# returns
NAME                 CAPACITY   ACCESS MODES   RECLAIM POLICY   STATUS      CLAIM   STORAGECLASS   REASON   AGE
postgres-pv-volume   5Gi        RWX            Retain           Available           manual                  5s
Notice that its status is set to available. We will see how that changes once our claim succeeds.
kubectl apply -f pvc.yaml
kubectl get pv postgres-pv-volume

# returns
NAME                 CAPACITY   ACCESS MODES   RECLAIM POLICY   STATUS   CLAIM                       STORAGECLASS   REASON   AGE
postgres-pv-volume   5Gi        RWX            Retain           Bound    default/postgres-pv-claim   manual                  45s
You can see it is changed to ‘Bound’. The ‘Claim’ column now shows which PersistentVolumeClaim has claimed it.
HostPath
Another important thing you need to remember especially when we are using HostPath is postgres data will persist even when you delete your PersistentVolume. Verify with
kubectl delete pvc postgres-pv-claim
kubectl delete pv postgres-pv-claim
Find out on which node PersistentVolume stores the data and navigate to /mnt/data (see PersistentVolumeClaim above).
# SSH into each node
ssh kubeadmin@172.16.16.20{1,2,3} # IP address depends on how you create or access your cluster.
sudo ls -la /mnt/data
In my particular instance, PersistentVolume mount was created on node 172.16.16.201
kubeadmin@kworker1:/$ sudo ls -la /mnt/data/
total 132
drwx------ 19  999 root             4096 Jul 15 01:12 .
drwxr-xr-x  3 root root             4096 Jul 14 16:14 ..
-rw-------  1  999 systemd-journal     3 Jul 14 16:14 PG_VERSION
drwx------  6  999 systemd-journal  4096 Jul 14 16:14 base
drwx------  2  999 systemd-journal  4096 Jul 15 01:07 global
drwx------  2  999 systemd-journal  4096 Jul 14 16:14 pg_commit_ts
drwx------  2  999 systemd-journal  4096 Jul 14 16:14 pg_dynshmem
-rw-------  1  999 systemd-journal  4821 Jul 14 16:14 pg_hba.conf
-rw-------  1  999 systemd-journal  1636 Jul 14 16:14 pg_ident.conf
drwx------  4  999 systemd-journal  4096 Jul 15 01:12 pg_logical
drwx------  4  999 systemd-journal  4096 Jul 14 16:14 pg_multixact
drwx------  2  999 systemd-journal  4096 Jul 14 16:14 pg_notify
drwx------  2  999 systemd-journal  4096 Jul 14 16:14 pg_replslot
drwx------  2  999 systemd-journal  4096 Jul 14 16:14 pg_serial
drwx------  2  999 systemd-journal  4096 Jul 14 16:14 pg_snapshots
drwx------  2  999 systemd-journal  4096 Jul 15 01:12 pg_stat
drwx------  2  999 systemd-journal  4096 Jul 14 16:14 pg_stat_tmp
drwx------  2  999 systemd-journal  4096 Jul 14 16:14 pg_subtrans
drwx------  2  999 systemd-journal  4096 Jul 14 16:14 pg_tblspc
drwx------  2  999 systemd-journal  4096 Jul 14 16:14 pg_twophase
drwx------  3  999 systemd-journal  4096 Jul 14 16:14 pg_wal
drwx------  2  999 systemd-journal  4096 Jul 14 16:14 pg_xact
-rw-------  1  999 systemd-journal    88 Jul 14 16:14 postgresql.auto.conf
-rw-------  1  999 systemd-journal 29525 Jul 14 16:14 postgresql.conf
-rw-------  1  999 systemd-journal    36 Jul 15 01:06 postmaster.opts
The data is still here even when PersistentVolume was already deleted. Keep this in mind when updating your password in your Secret object, because the password needs to be updated within Postgres as well.
Deployment
The last two remaining objects are Deployment and Service. Deployment object runs our database as a Pod while Service exposes the application, so other apps in the cluster can communicate with it. A Pod is the smallest worker unit in your cluster. Inside, you can have one or more containers. If you have more than one, these containers are always together sharing resources and scheduled as a single unit. To scale your application up, you can increase the number of replicas in your Deployment and in turn the number of Pods will correlate with how many replicas you set.
Here we name our Deployment as ‘postgres’ with a single Pod enforced by replicas: 1; so only one Pod for this one Deployment. The container image is postgres:16.0. I like to explicitly state its major and minor version instead of using the latest tag because it will be easier to reproduce when you run into an issue.
For configuration values, we load them from environment variables in two ways. .spec.template.spec.containers[0].envFrom loads our ConfigMap object by name while .spec.template.spec.containers[0].env loads our database password from the Secret object.
#  /k8s-devops/db/deployment.yaml

apiVersion: apps/v1
kind: Deployment
metadata:
  labels:
    app: postgres
  name: postgres
spec:
  replicas: 1
  selector:
    matchLabels:
      app: postgres
  template:
    metadata:
      labels:
        app: postgres
    spec:
      containers:
        - image: postgres:16.0
          name: postgres
          imagePullPolicy: IfNotPresent
          ports:
            - containerPort: 5432
          envFrom:
            - configMapRef:
                name: db-credentials
          env:
            - name: POSTGRES_PASSWORD
              valueFrom:
                secretKeyRef:
                  name: postgres-secret-config
                  key: POSTGRES_PASSWORD
          volumeMounts:
            - mountPath: /var/lib/postgresql/data
              name: postgres-pv-storage

      volumes:
        - name: postgres-pv-storage
          persistentVolumeClaim:
            claimName: postgres-pv-claim
The .spec.template.spec.containers[0].env.name has to match what postgres expects as an environment variable which is POSTGRES_PASSWORD. The .env.valueFrom.secretKeyRef.key, on the other hand, although it has the same string, has to match with what we have in sealed-secrets.yaml
#  /k8s-devops/db/deployment.yaml

env:
...valueFrom:
    secretKeyRef:
      name: postgres-secret-config
      key: POSTGRES_PASSWORD <- must match with
#  /k8s-devops/db/sealed-secrets.yaml

spec:
  encryptedData:
    POSTGRES_PASSWORD: AgCAJxd4LMUD9O18E5yt... <- match with this
Next, the Postgres default volume mount which is /var/lib/postgresql/datawill use PersistentVolumeClaim that we already have created.
Apply with
kubectl apply -f deployment.yaml
Check that your database is up by using kubectl’s get subcommand followed by the object (Deployment) and its name (postgres).
kubectl get deployment postgres

# returns
NAME       READY   UP-TO-DATE   AVAILABLE   AGE
postgres   1/1     1            1           3m49s
If we check how many Pods we have, we only get one, as expected due to replicas: 1.
kubectl get po

# returns
NAME                        READY   STATUS    RESTARTS   AGE
postgres-5598db5bb4-jznqd   1/1     Running   0          11m
Service
A Service object is how Pods and Deployments can be accessed. It creates a corresponding DNS entry for other applications to refer to. The DNS is created in a format of <service-name>.<namespace-name>.svc.cluster.local so that means our DNS entry will be postgres.default.svc.cluster.local.
The Service name can be arbitrary, but has been set as ‘postgres’ like the Deployment name, just to make it confusing.
There are four types of services which are NodePort, ClusterIP, LoadBalancer, and ExternalName. If not specified, it will default to ClusterIP. ClusterIP means this Service is mapped to an IP address across nodes, but only available within the cluster. NodePort makes it available to the outside by exposing a static port on each node, then forwards requests to ClusterIP. LoadBalancer type is used with external load balancer with an Ingress object, or managed k8s clusters such as Amazon’s or Google’s. ExternalName maps a Service to a DNS name.
#  /k8s-devops/db/service.yaml

apiVersion: v1
kind: Service
metadata:
  name: postgres
  labels:
    app: postgres
spec:
  type: ClusterIP
  ports:
    - port: 5432
  selector:
    app: postgres
Port is 5432 which is postgres’ default port number. Of course this setting can be changed using the ConfigMap technique we have seen.
Apply with
kubectl apply -f service.yaml
Check with
kubectl get svc

# returns
NAME         TYPE        CLUSTER-IP      EXTERNAL-IP   PORT(S)    AGE
kubernetes   ClusterIP   10.96.0.1       <none>        443/TCP    10d
postgres     ClusterIP   10.105.21.101   <none>        5432/TCP   3s
At this stage, the database can be accessed within the cluster. I think it is important to attempt this because it can dispel some of the magic k8s handling of networking so let us try and do that. The IP address 10.105.21.101 we see above is curious, so maybe we can do something with it.
Let us try doing a simple netcat to show that the database listens to the address and port we think it is. First, SSH into one of the worker Pods. If you followed my previous post, it is one of the three of 172.16.16.20{1,2,3}.
ssh kubeadmin@172.16.16.201
If we run a netcat program (nc) with verbose output flag
nc -v 10.105.21.101 5432

# returns
10.105.21.101: inverse host lookup failed: Unknown host
(UNKNOWN) [10.105.21.101] 5432 (postgresql) open
Only the last line is relevant, and it shows that port 5432 is indeed opened. If you SSH to other nodes, it will show the same. This is because we defined a Service with ClusterIP type — this single IP can be used to access our database. In reality however, our (micro)services are not going to reference this IP address because it can always change. Instead, we use its DNS entry which is postgres.default.svc.cluster.local. The short version, postgres, can be used as long as you are calling from the same default namespace.
~~
Using netcat is a success, but it only shows the port is opened. A stronger evidence to show this is working is to connect using a postgres client like psql. The deployed database does not include this tool, but we can run a one-off Pod that runs psql command and attempts to log in. We need to retrieve database the password and store it in a variable. The secret is encoded with base64, so we need to pipe it with a decoder.
POSTGRES_PASSWORD=$(kubectl get secret --namespace default postgres-secret-config -o jsonpath="{.data.POSTGRES_PASSWORD}" | base64 --decode)
Without -o jsonpath..., it will return a full JSON file. We can traverse the file using the k8s way with {.data.POSTGRES_PASSWORD}. It is almost similar to how jq does but there is a dot in front.
Next we run this Pod named with psql-client that deletes itself after it exits using --rm and --restart='Never'. It is critical that we set the password to PGPASSWORD environment variable along with other parameters. The user, database name, and port are what we expected. What is interesting is the host. We did not specify any namespace in the command below, so implicitly we are running under the default namespace. So to access the database, we simply use the name of the Service which is postgres. Accessing using this DNS name is the important part mentioned in the beginning of this post.
kubectl run psql-client \
    --rm \
    --tty \
    -i \
    --restart='Never' \
    --namespace default \
    --image postgres:16.0 \
    --env="PGPASSWORD=$POSTGRES_PASSWORD" \
    --command -- psql --host postgres -U user -d my_db -p 5432
You will see the psql prompt. Success!
If you don't see a command prompt, try pressing enter.
my_db=#
From here, you can try out a command
my_db=# SELECT TRUE;
 ?column?
----------
 t
(1 row)
Exiting (type \q) will delete the Pod
my_db=# \q
pod "psql-client" deleted
Should You Use A Database in Kubernetes?
The big question now is whether it is a good idea to use this database. For demonstration purposes, yes. But there are many considerations that we need to think about using a database inside a cluster. Data needs to persist as such that it should not be gone the next time we recreate our cluster. In the same vein, backing and restoring are an important aspect of database management. It also needs to be scalable, whether you are opting for highly-available (HA) or you want a separate write and read node. You also want a monitoring solution so you know if there are slow queries bringing down your applications. Many times it is easier to use a managed database solution rather than hosting on your own.
Things to consider when self-hosting a database
-
Can Backup AND Verify Restore
- Includes stored procedures, triggers
- A backup is useless if a restore has not been verified
-
Upgrade with zero downtime
- Minor and major version
- Security and TLS
-
Scale horizontally
- Replicas
- Read and Write Nodes
-
High Availability
- Failover
- Uptime - five nines
- Monitoring
- Cloning
- Connection Pooling
- Partitioning / Sharding
Nevertheless, deploying a proper database in k8s properly is certainly possible. There are several projects that have the above features integrated like CrunchyData Postgres Operator, Zalando, Cloud Native PG, and others.
We did not go full throttle with those solutions but deploying this way gives a lot of opportunities to learn various k8s objects particularly PersistentVolume, PersistentVolumeClaim, and Secret.
Backend
For our api backend, it is going to listen and process requests to and fro the frontend. So this part needs to be port forwarded. Within the cluster, the api needs to communicate with the database. From the previous section, we already know how. We are not going to use its IP address because that can change. Instead, we need to use its DNS entry which is postgres. Lastly, database migration needs to happen because there’s no table created yet.
Why Go
The backend is going to be a Go program just to simplify things. A Go program can compile to a self-contained single statically-linked binary. That means you can simply hand over this single binary path to systemd, or even type ./api and it will run without any external dependencies. Go’s built-in standard library is extensive and covers many use cases meaning for our simple api, we do not need many third-party libraries or use any frameworks to create a production-grade api server. In fact, this api only uses two external libraries — one for Postgres database driver, and another for database migration. All other things including router multiplexer (mux), cors middleware, reading config, graceful shutdown, and HTTP server are handled by the standard library. However, to be fair this api is a simple program without both authentication and authorization, no input validation, no caching, and no testing.
Only snippets are shown here. For the full code, please visit https://github.com/gmhafiz/k8s-api
Entrypoint
The api’s entry point is located at cmd/api/main.go. We create a new server that reads configuration from environment variables, sets up the router, and connects to the database. We have three routes; a /healthz to see if the api is up, a /ready endpoint to see if it has a database connection by running SELECT true;, and a /randoms endpoint that lists the latest ten UUIDs as well as to create a new one. We also have CORS middleware set up because the origin address and port from the frontend (:8080) is going to be different from this api (:3080).
Container Probes
// /k8s-api/cmd/api/main.go

func main() {
	ctx := context.Background()
	srv := app.New(ctx)

	srv.Mux.Handle("/healthz", recovery(cors(http.HandlerFunc(srv.Healthz))))
	srv.Mux.Handle("/ready", recovery(cors(http.HandlerFunc(srv.Ready))))
	srv.Mux.Handle("/randoms", recovery(cors(http.HandlerFunc(srv.Randoms))))
The two endpoints, /healthz and /ready are typically found in an api program to be used with k8s. In a Pod lifecycle, a Pod is in a Running state when the Pod has been bound to the node, all containers have been created (we only have one), and at least one container is running. These endpoints are used by container probes as extra feedback to let k8s know if this Pod is ready to accept user requests. A particular Pod may not have a connection to the database, so we might prefer to route incoming requests to another Pod that is ready. K8s queries /ready endpoint (that does SELECT true;) to find out if it should route the requests or not. The /healthz endpoint on the other hand is used in conjunction with ’livenessProbe’. This probe is used to indicate if the container (our api) is running. In a situation where the api crashes, liveness probe will return a fail result, and it will kill the container. We designed our api in such a way that it can recover from a panic (it’s like an exception but in Go) so hopefully a crash will not happen. More details on the type of probes here.
Environment Variables
The app connects to the database using a connection pool. All of these settings are read from environment variables.
// /k8s-api/database.go

func NewDB(ctx context.Context, cfg Database) (*pgxpool.Pool, error) {
	dsn := fmt.Sprintf("postgres://%s:%d/%s?sslmode=%s&user=%s&password=%s",
		cfg.Host,
		cfg.Port,
		cfg.Name,
		cfg.SslMode,
		cfg.User,
		cfg.Pass,
	)

	return pgxpool.New(ctx, dsn)
}
Moving on, the api listens for requests at the address host:port initiated by the function server.ListenAndServe() in a separate goroutine which is done by calling it inside an anonymous function prepended with go keyword.
// /k8s-api/cmd/api/main.go

...continue from main()

addr := fmt.Sprintf("%s:%d", srv.Api.Host, srv.Api.Port)
log.Printf("running api at %v\n", addr)

server := &http.Server{Addr: addr, Handler: srv.Mux}
go func() {
    if err := server.ListenAndServe(); !errors.Is(err, http.ErrServerClosed) {
        log.Fatalf("ListenAndServe(): %v", err)
    }
}()
Graceful Shutdown
Imagine our api is chugging along and handles traffic normally, and then we want to do an update to it. We create a new commit, push to a repository, image is now built and now k8s want to deploy this new version to the cluster. K8s creates new Pods with the new version in the cluster and now traffic goes to both Pods containing old and new versions of the api. Once all (or some, depending on deployment strategy) new Pods are up, old Pods will be shut down. Two questions need to be asked, what happens to requests that are still being processed in the api after k8s wants to shut the Pod down?; and would not the api needs to free (close) database connection so others can use it?
If the Pods are killed abruptly to make way for new Pods, requests that have not been completed will also be immediately terminated and users will get an error. This is definitely not a desirable behaviour, and we need to remedy this.
When k8s wants to shut a Pod down, it first sends an operating system signal called SIGTERM to the Pod and this marks the beginning of a default 30-second grace period. We need the api to capture this signal, so it knows not to accept any more requests and begin the process of shutting down which includes taking the chance to close all remaining resources like closing database connection, other HTTP calls, opened files, or other resources.
To implement graceful shutdown, we create a buffered channel to catch all terminate (SIGTERM), stop (SIGSTOP), and interrupt (SIGINT) operating system signal to a variable called stop. Once the channel receives any of these signals, it does two things. Firstly, the api’s HTTP server stops receiving any more new requests and secondly, the line <-stop unblocks and runs subsequent lines. First thing it does is it runs server.Shutdown() line with a timeout we define as five seconds. If everything goes well, the next piece of code which is database shutdown is run and finally api exits and the Pod is removed.
...continue from above

stop := make(chan os.Signal, 1)
signal.Notify(stop, syscall.SIGINT, syscall.SIGSTOP, syscall.SIGTERM)

<-stop

ctx, cancel := context.WithTimeout(context.Background(), 5*time.Second)
defer cancel()
if err := server.Shutdown(ctx); err != nil {
    log.Printf("error while shutting down: %v\n", err)
}

srv.DB.Close()
However, if k8s gets no response after the default of a 30-second grace period, k8s is going to do a hard kill using SIGKILL. This signal cannot be caught by the api process so any remaining resources cannot be closed gracefully. This is why it is important to do the graceful shutdown in the api ourselves.
If we zoom out and look at how k8s handles termination lifecycle, k8s will immediately set the Pod’s state as ‘Terminating’ and stops sending any more traffic to it. This is great which means k8s already does one job for us. Shutting down resources are still necessary though.
Note: In other applications where nginx is being used in front of an api, nginx will intercept that signal and will perform a graceful shutdown. However, the api still needs to close all other resources like database, network connections and others.
Note: Requests that take longer than the grace period will be cancelled and cause bad user experience. You can extend this grace period, but you have to evaluate if doing so is the correct approach.
Trivia: Ever had to use Ctrl+C to stop things in the terminal? you are actually sending a SIGINT signal! Ctrl+Z is SIGSTOP.
Migration
For database migration, we are supporting both one-level ‘up’ and ‘down’ operations. Which operation to run is determined by a flag that accepts either ‘up’ or ‘down’. We will see that through kubernetes, we can pass command line flags to determine the direction of migration.
//go:embed migrations/*.sql
var embedMigrations embed.FS

func (m *Migrate) Up() {
	if err := goose.Up(m.DB, "migrations"); err != nil {
		log.Panic(err)
	}
	...
}

func (m *Migrate) Down() {
	if err := goose.Down(m.DB, "migrations"); err != nil {
		log.Panic(err)
	}
    ...
}
All in all, we have built a simple production-grade api server that can list and create records, runs migration, and has graceful shutdown using only Go’s excellent standard library plus two external dependencies, and without any HTTP server like nginx in front of it.
Tagging
After talking in great length about the api design, we can move on to building container images. We will be making a new image for every git commit so that we can differentiate one image from another. One easy way is to use tags, which are simply strings that we can use to identify a particular commit or build. We need this to be unique-ish so there are no name conflicts when choosing which image k8s is going to pull. There are three (but not limited to) possible ways to construct this string. Firstly, we can tag the image the same as our api’s version, for example if our api version is v1.2.3, we also tag our image the same. Secondly, we can simply use our api’s latest git commit. Thirdly, a combination of the first two. Here, I am showing the second approach.
TAG=$(git rev-parse HEAD)
echo $TAG
This will yield its SHA hash that looks like this: 334ed70d2fcbdb6936eaef84b7385fab8b545b0a. Some people like a shorter version which can be done by adding --short parameter.
TAG=$(git rev-parse --short HEAD)
echo $TAG

# returns
334ed70
The short version can look nicer when combined with api’s version for example gmhafiz/api:v1.2.3-334ed70.
Once the image is tagged, we can easily reference that from our kubernetes Deployment object. But before going into that, let us take a step back and build an image.
Containerise
What is left we need to turn this codebase into an image. We use a multi-stage technique for this so the final image only contains necessary files and thus keeping it small. In the first stage we name as build, we copy dependency files go.{mod,sum} and run go mod download to retrieve third-party dependencies. For subsequent builds, if there are no modification to the both dependency files, no download is necessary because it will simply use Docker cache making image building much faster.
#  /k8s-api/Dockerfile-api

FROM golang:1.21 AS build

WORKDIR /go/src/app/

# Copy dependencies first to take advantage of Docker caching
COPY go.mod ./
COPY go.sum ./
RUN go mod download
To compile, copy all the files and run go build command. The ldflags -w and -s strips debugging symbols because those are not needed for production. We name the final binary as api using the -o flag.
#  /k8s-api/Dockerfile-api

COPY . .

# Build Go Binary
RUN CGO_ENABLED=0 GOOS=linux go build -ldflags="-w -s" -o ./api cmd/api/main.go
That completes the first stage. In the second stage, we pick a minimal base image called distroless. We could have used scratch image that contains nothing because our Go binary is self-contained. However, a distroless image has the added convenience of included ca-certificate for external TLS URL call and timezone built into the image. Also, we use nonroot tag so our api runs in a rootless container. We then copy the binary from the previous stage to /usr/local/bin/api and set its entrypoint.
#  /k8s-api/Dockerfile-api

FROM gcr.io/distroless/static-debian12:nonroot

LABEL com.example.maintainers="User <author@example.com>"

COPY --from=build /go/src/app/api /usr/local/bin/api

EXPOSE 3080

ENTRYPOINT ["/usr/local/bin/api"]
To build this image, we supply the path to this file using the -f flag. This was only necessary because we picked a file name other than Dockerfile. We name this image as gmhafiz/api. The name must match with the repository path we will see later. For now, we simply use the format of <docker login name>:<repository name>. We also tag this image with its git SHA hash. Without it, it will default to latest. The dot in the end simply means current directory.
docker build -f Dockerfile-api -t gmhafiz/api:$TAG .
Once the build is done, we can see the created image by running docker images command.
docker images | grep gmhafiz

# returns
gmhafiz/api    334ed70d2fcbdb6936eaef84b7385fab8b545b0a    799e8933a899   5 seconds ago   11.5MB
The resulting image only contains our single compiled binary along with what distroless image provided — thanks to the multi-stage approach. In the final image, there are no compile tools, operating system, shell or other stuff not needed to run this api resulting in a relatively small image size at around 11 megabytes.
One other thing we need to do is to create the database table and subsequently populate some random UUIDs. Its Dockerfile is identical to the api’s except it has a different binary name, and thus a different entrypoint.
# #  /k8s-api/Dockerfile-migrate

FROM golang:1.21 AS build

WORKDIR /go/src/app/

COPY go.mod ./
COPY go.sum ./
RUN go mod download

COPY . .

RUN CGO_ENABLED=0 GOOS=linux go build -ldflags="-w -s" -o ./api cmd/migrate/main.go

FROM gcr.io/distroless/static-debian12:nonroot

LABEL com.example.maintainers="User <author@example.com>"

COPY --from=build /go/src/app/migrate /usr/local/bin/migrate

ENTRYPOINT ["/usr/local/bin/migrate"]
To build, pick a different name, like gmhafiz/migrate
docker build -f Dockerfile-migrate -t gmhafiz/migrate:$TAG .
Container registry
For our cluster to retrieve this image, it needs to be stored somewhere. We can buy a domain name and reverse proxy to a container registry hosted in our server we own, or use ngrok if you do not want to buy a domain name yet. For now, the easiest way is to simply use a free solution like Docker hub registry. This registry is a special repository of images that k8s can pull images from. There are many other hosted registries like Github, Gitlab, from the big three cloud services, self-hosted from quay.io, docker registry, Harbor, peer-to-peer ones like Uber’s kraken, and many others.
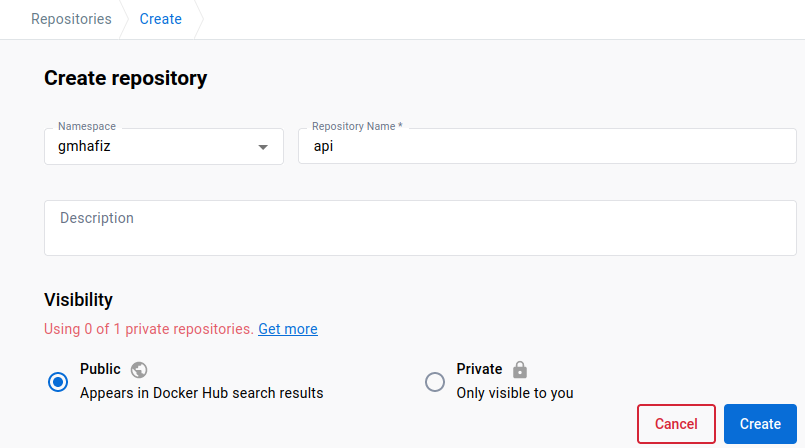
First create a new repository from the web at https://hub.docker.com/repository/create. Note that the namespace and repository name is reflective of our image’s name of gmhafiz/api.
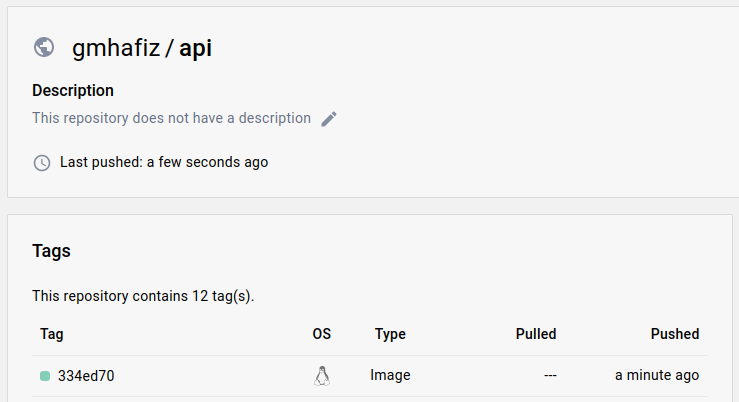
Once the repository is created, you may push it.
docker push gmhafiz/api:${TAG}
When you refresh, you will see the image has been successfully uploaded and is ready to be downloaded by your cluster.
Secrets
There is a reason why there are separate demo repositories you see at the top of this post. In this fictional case, the fullstack developer only develops the frontend and backend but fortunately has no access to the production database. Cluster management including managing database password is left to us, the devops. If you see in the applications/api directory, there is no Secret object, instead the api will reference the same Secret object as the database.
The api requires credentials to the database for it to work. However, the backend developer is not privileged to this information as they are sensitive. Only devops or database architect teams are privy to this information. The database sealed-secrets.yaml file is encrypted so the password cannot be retrieved by the api developer even when the files are hosted in a public repository. A potential issue is when api developers are also allowed access to the k8s cluster. There can be many reasons for this. We might allow api developers to see if their api is deployed. We might also allow them to scale up or down its Pods. However, giving users full access to the cluster by sharing the same credentials as cluster admin also means that the api developer can retrieve database password which we do not want. To prevent this, we need to apply an authorization system. Fortunately, Kubernetes has one built-in. Let us make a new user in the cluster with restricted access using Role-based Access Control.
Note: Username and password is not the only way for the app to access the database. We want the connection to be encrypted such as using TLS. That means creating a signed client certificate for the app. However, we still need to define variables like database port and host name.
RBAC
In a Role-based Access Control (RBAC), we apply a rule saying an entity(dev007) has a role(dev) to perform(deploy) a deployment. All this can be done with a k8s object called Role and RoleBinding. They way we design is following k8s’ default behaviour which is Principle of Least Privilege, which means by default, we deny everything, but we are going to add or allow specific rules (whitelist).
Create User
First step is to create a user. There is a great guide at https://docs.bitnami.com/tutorials/configure-rbac-in-your-kubernetes-cluster/ that creates a separate namespace that I refer to a lot, so I will breeze through here. What I am showing differs in such a way that this dev007 is going to be in the same ‘default’ namespace instead.
To create a user, we make use of Public Key Infrastructure (PKI). There are alternatives to PKI approach like external auth such as OPA Gatekeeper, Kyverno, OAuth, etc. The downside of PKI is we cannot revoke a user’s certificate without also revoking all other users’ access in the cluster.
The user dev007 needs to run a series of commands:
### Run by user 👷 dev007 only.

# Create a private key
openssl genrsa -out dev007.key 2048 # Very private, don't expose to anyone else except user dev007
chmod 400 dev007.key # ensure only dev007 has the permission to read this file.

# User dev007 creates a certificate signing request (CSR). The CN (Common Name) is the
# important identity name.
openssl req \
    -new \
    -key dev007.key \
    -out dev007.csr \
    -subj "/CN=dev007"
The .csr is sent to the cluster admin which is us to be signed and to create an X509 client certificate.
### Run by 🦸🏽♂️ cluster admin
# Locate your cluster's CA (certificate authority) to sign this CSR.
# Location is in /etc/kubernetes/pki/ so you may need to SSH into one of the nodes.
# dev007 sends the csr file to cluster admin. And cluster admin signs it and returns dev007.crt
# file to that user.
openssl x509 \
-req \
-in \
dev007.csr \
-CA CA_LOCATION/ca.crt \
-CAkey CA_LOCATION/ca.key \
-CAcreateserial \
-out dev007.crt \
-days 7 # Best practice is to make it short, and renew.
We can inspect the content of the certificate with the following command and see the window period of validity.
openssl x509 -in dev007.crt -text -noout

# returns
Certificate:
    Data:
        Version: 1 (0x0)
        Serial Number:
            12:b5:db:df:38:6d:04:22:99:56:0b:ec:f4:54:c6:2d:a3:02:34:24
        Signature Algorithm: sha256WithRSAEncryption
        Issuer: CN = kubernetes
        Validity
            Not Before: Jul 16 04:09:46 2023 GMT
            Not After : Jul 23 04:09:46 2023 GMT
        Subject: CN = dev007
        Subject Public Key Info:
            Public Key Algorithm: rsaEncryption
                RSA Public-Key: (2048 bit)
    ...
Logging In (Authentication)
dev007 is able to log in using the two files, this client certificate (dev007.crt) generated by k8s admin, and private key (dev007.key) generated by that user earlier. The first step is to create a new credential (new user) using set-credentials command:
### Run by user 👷 dev007.

kubectl config set-credentials dev007 \
    --client-certificate=/home/dev007/.certs/dev007.crt \
    --client-key=/home/dev007/.certs/dev007.key
Cluster name is kubernetes if you follow my previous guide of vanilla installation. If using minikube, the cluster name is minikube. Find out the name by looking at your ~/.kube/config file.
The user dev007 can set the context called ‘dev-context’ with the following:
### Run by user 👷 dev007.

kubectl config set-context dev-context --cluster=kubernetes --user=dev007
At this time, the user dev007 will not be able to access anything yet.
### Run by user 👷 dev007.

kubectl --context=dev-context get pods

# returns
Error from server (Forbidden): pods is forbidden: User "dev007" cannot list resource "pods" in API group "" in the namespace "default"
Because that is the default behaviour which is to deny all. You need to whitelist what the role that user dev007 belongs to is allowed to do.
Create RBAC Policy
We need two more objects, a Role and a RoleBinding. This Role named ‘dev’ is in the current default namespace because we did not specify one here. Under an array of rules, the first item is apiGroups. Empty string "" indicates this is the core API group.
#  /k8s-devops/role.yaml

kind: Role
apiVersion: rbac.authorization.k8s.io/v1
metadata:
  name: dev
rules:
- apiGroups: ["", "apps"]

  # we allow developers to see deployment, pods, and scale up or down
  resources: ["deployments", "replicasets", "pods"]

  verbs: ["get", "list", "watch", "create", "update", "patch", "delete"]
We also add apps to this apiGroup. ‘apiGroups’ documentation is probably hidden from the official docs because I cannot find it using the search box, but we can list what ‘apps’ is for with the following command. We can see that ‘ReplicaSet’ is among them.
kubectl api-resources | grep apps

# returns
controllerrevisions                  apps/v1                      true         ControllerRevision
daemonsets              ds           apps/v1                      true         DaemonSet
deployments             deploy       apps/v1                      true         Deployment
replicasets             rs           apps/v1                      true         ReplicaSet
statefulsets            sts          apps/v1                      true         StatefulSet
If you notice, I tend to use the short form to save up typing. For example po for pods. deploy for deployment and so on. The kubectl api-resources lists these short forms to save some typing.
We want to allow dev007 to deploy, scale and see pod logs, so we add to the ‘resources’ list. Finally, we whitelist what this role (verbs) can do. Notice that there is no Secret object in the resource list. This prevents anyone with the role ‘dev’ from inspecting any Secret content.
To apply dev007 user to this role, we use a RoleBinding object. Since we only have one user so far, there is only one item is in the .subjects array.
#  /k8s-devops/role-binding.yaml

kind: RoleBinding
apiVersion: rbac.authorization.k8s.io/v1
metadata:
  name: dev-role-binding
subjects:
- kind: User
  name: dev007
  apiGroup: ""
roleRef:
  kind: Role
  name: dev # must match with Role's metadata.name
  apiGroup: ""
As the cluster admin, apply both with
kubectl apply -f role.yaml
kubectl apply -f role-binding.yaml

# returns
role.rbac.authorization.k8s.io/dev created
rolebinding.rbac.authorization.k8s.io/dev-role-binding created
If user dev007 retries the get pods command,
kubectl --context=dev-context get pods

# returns
NAME                        READY   STATUS    RESTARTS      AGE
postgres-5598db5bb4-jznqd   1/1     Running   1 (88m ago)   7d1h
It returns one database Pod as expected because this database has already been deployed. Now, let us try to access the Secret object.
kubectl --context=dev-context get secret

Error from server (Forbidden): secrets is forbidden: User "dev007" cannot list resource "secrets" in API group "" in the namespace "default"
As expected, the user cannot access the Secret object because the role ‘dev’ does not have access to it.
This concludes the Secrets section and in summary, this is what we have in this section:
User name    : dev007
context      : dev-context
role         : dev
role-binding : dev-role-binding
API Settings
That was a long detour from Secrets section. But jumping back to api, from its point of view, it needs to have the environment variable for database password, api’s host, and api’s port. We already have created a SealedSecret for database password, so we can reuse that. For the rest of those api settings, we can create a new ConfigMap. Remember that the api developer has no idea what these values are. Only the k8s devops person knows and manages these values.
API_PORT environment variable is going to be an integer 3080. The database port on the other hand is going to be the integer 5432. The rest are the database’s user, name and host. Notice that the DB_HOST value is ‘postgres’ which is the DNS entry for postgres service.
# As devops
# /k8s-devops/db/configmap.yaml

apiVersion: v1
kind: ConfigMap
metadata:
  name: api-parameters
  labels:
    app: api
data:
  # to read a value as integer, use its hex value from ascii command
  API_PORT: "\x33\x30\x38\x30"

  DB_USER: "user"
  DB_NAME: "my_db"

  DB_PORT: "\x35\x34\x33\x32"

  DB_HOST: "postgres"
In both API_PORT and DB_PORT, you can see some strange encoding. ConfigMap can only store string. It even cannot store an integer or boolean either. Our api however cannot accept a string as integer because Go is a statically typed language. We can modify our api to read the ports as strings, then convert to integers. We can consider putting DB_PORT into our Secret. The same goes with API_PORT, although it is not really a secret. Other ways include using a Helm chart, and injecting environment variables. ConfigMap allows us to embed a file so perhaps our api can parse a yaml file instead of reading configurations from environment variables.
All those options are a headache so one trick we can use here is to use values seen from the ascii with hex table flag switched on.
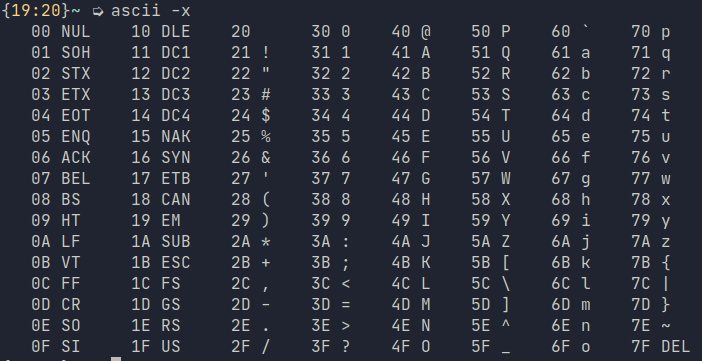
As you can see from the fourth column, the encoding for 0 or zero, is hex 30. For the number 5, go down the column, and you will see it is 35. To construct a series of integers, what we need to do is to escape the literal encoding for hex using \x and pick the numbers.
| Decimal | Result |
|---|---|
| 5 | \x35 |
| 4 | \x34 |
| 3 | \x33 |
| 2 | \x32 |
Thus, the integer 5432 then becomes \x35\x34\x33\x32.
Apply with
kubectl apply -f configmap.yaml
At this stage, you should have three ConfigMaps in the cluster.
kubectl get cm

# returns

NAME               DATA   AGE
api-parameters     5      18s
db-credentials     2      25m
kube-root-ca.crt   1      7d11h
Deployment
Now that we have both ConfigMap and Secret applied, we can create a Deployment. We give it a name as server with three replicas, so there are going to be three Pods.
The .spec.strategy specifies how we replace old Pods with new ones. We did not specify one when deploying our database, so it defaults to rollingUpdate. Other strategies are recreate, blue-green, canary, and more advanced way with A/B deployments. In rollingUpdate, since we have three Pods, upon a new deploy, k8s will spin up one Pod and wait for it to be ready before replacing the next Pod. This is because maximum surge is 25%. In other words, it will only replace a rolling 25% of the Pods at a time. This also means while deployment is underway, requests will to go to either old or new pods.
Then we specify an array of containers. We only have one called ‘gmhafiz/api’. The image is also tagged to our latest git commit hash. If we want to update our deployment, this is where we edit in order to push the latest code to production!
Resources are important. Here we limit memory consumption to 128Mi and cpu cycles are limited to 500m.
Then we tell k8s that in order to check if the api is ready to receive requests, query /ready endpoint at port 3080. This is done by the .spec.containers[].readinessProbe setting.
The last two remaining parts are configuration files. Database password is loaded from ‘postgres-secret-config’ secret while all other api configurations are loaded from ‘api-parameters’ ConfigMap.
#  /k8s-devops/api/server.yaml

apiVersion: apps/v1
kind: Deployment
metadata:
  labels:
    app: server
  name: server
spec:
  replicas: 3
  selector:
    matchLabels:
      app: server
  strategy:
    rollingUpdate:
      maxSurge: 25%
      maxUnavailable: 25%
  template:
    metadata:
      labels:
        app: server
    spec:
      containers:
      - image: gmhafiz/api:6be26935ae705e3b1ff2b3e6210eb98b9182f0bf
        name: api
        resources:
          limits:
            cpu: "500m"
            memory: "128Mi"
        readinessProbe:
          httpGet:
            path: /ready
            port: 3080
          successThreshold: 3
        envFrom:
          - configMapRef:
              name: api-parameters
        env:
          - name: DB_PASS
            valueFrom:
              secretKeyRef:
                name: postgres-secret-config
                key: POSTGRES_PASSWORD
Although the key to the password is POSTGRES_PASSWORD (which is what postgres expects), we can redefine it to what our api expects to be DB_PASS.
Apply with
kubectl apply -f server.yaml
and check with kubectl get deploy and you will see three replicas are ready and available:
kubectl get deploy

# returns
NAME       READY   UP-TO-DATE   AVAILABLE   AGE
postgres   1/1     1            1           5d23h
server     3/3     3            3           6d15h
Migrate Up
Our api is now deployed and can connect to the database. However, the database has no table yet. We can SSH into the cluster and use the one-off Pod trick to connect to the database we saw in the database section and manually copy and paste our migration sql file. But this approach is imperative and you need to remember many commands with manual copying and pasting.
A more elegant solution is to run a one-off Job that runs the migrate command. So let us prepare its container image first.
# k8s-api/Dockerfile-migrate

FROM golang:1.21 AS build

WORKDIR /go/src/app/

COPY go.mod ./
COPY go.sum ./
RUN go mod download

COPY . .

RUN CGO_ENABLED=0 GOOS=linux go build -ldflags="-w -s" -o ./migrate cmd/migrate/main.go

FROM gcr.io/distroless/static-debian12:nonroot

LABEL com.example.maintainers="User <author@example.com>"

COPY --from=build /go/src/app/migrate /usr/local/bin/migrate

ENTRYPOINT ["/usr/local/bin/migrate"]
As you can see, our migration image is very similar to api’s. We use ENTRYPOINT at the end that runs the migrate binary. If only that command is supplied, it will do a default ‘up’ migration. If we supply a flag using -go, we can choose to migrate the other direction which is ‘down’.
// k8s-api/cmd/migrate/main.go

func main() {
	log.Println("starting migrate...")

	var migrateCommand string
	flag.StringVar(&migrateCommand, "go", "up", "-go up")
	flag.Parse()

	cfg := app.Config()
	db := app.DB(cfg.Database)

	migrator := app.Migrator(db)

	if migrateCommand == "up" {
		migrator.Up()
	} else if migrateCommand == "down" {
		migrator.Down()
	} else {
		log.Println("operation not supported")
	}
}
Since both api and migrate binaries share the same tag, this may be an undesirable side effect. Api tends to be updated more often which means its tag will also change often. The migrate image however has to follow suit even though there might be no change at all.
docker build -f Dockerfile-migrate -t gmhafiz/migrate:$TAG .
docker push gmhafiz/migrate:$TAG
As you can see from the code below, it also needs database credentials which are read from the environment variable. So in the Job manifest below under the ‘migrate’ container section, we put in the same ’envFrom’ and ’env’ to pull the values from Secret and ConfigMap respectively. As an api developer, they do not have to know the database password. Only you as a devops can.
# /k8s-devops/api/migrate-job.yaml

apiVersion: batch/v1
kind: Job
metadata:
  name: migrate-job
spec:
  template:
    spec:
      restartPolicy: Never
      containers:
        - name: migrate
          image: gmhafiz/migrate:6be26935ae705e3b1ff2b3e6210eb98b9182f0bf
          envFrom:
            - configMapRef:
                name: api-parameters
          env:
            - name: DB_PASS
              valueFrom:
                secretKeyRef:
                  name: postgres-secret-config
                  key: POSTGRES_PASSWORD
Another critical part in this Job is restartPolicy needed to be ‘Never’. The only other option is ‘OnFailure’ because the ‘Always’ option does not exist for this Job object. Upon a failure, we always want to inspect the logs rather than having k8s to retry again and again.
kubectl apply -f migrate-job.yaml
K8s will run this job as a Pod. That means we can try and look for its logs.
kubectl get pods

#returns
NAME                        READY   STATUS      RESTARTS      AGE
migrate-8rpjn               0/1     Completed   0             38s
The migration should be quick because not a lot of data was inserted. Notice that although the run has been completed, it is not removed from the cluster. This allows us to view the logs. To see the logs, we pass in the Pod’s name, along with a flag to follow.
kubectl logs -f migrate-8rpjn

#returns
2023/09/04 22:37:25 starting migrate...
2023/09/04 22:37:25 reading env
2023/09/04 22:37:25 connecting to database...
2023/09/04 22:37:25 database connected
2023/09/04 22:37:25 OK   20230302080119_create_randoms_table.sql (18.37ms)
2023/09/04 22:37:25 goose: successfully migrated database to version: 20230302080119
As a developer though, logs cannot be accessed.
# Run as developer

kubectl --context=dev-context logs -flu migrate-8rpjn

# returns
Error from server (Forbidden): pods "migrate-8rpjn" is forbidden: User "dev007" cannot get resource "pods/log" in API group "" in the namespace "default"
As the devops, role.yaml needs to be modified to allow developer access.
# k8s-devops/role.yaml

kind: Role
apiVersion: rbac.authorization.k8s.io/v1
metadata:
  name: dev
rules:
  - apiGroups: ["", "apps"]
    resources: ["deployments", "replicasets", "pods"] # we allow developers to see deployment, pods, and scale up or down
    verbs: ["get", "list", "watch", "create", "update", "patch", "delete"] # You can also use ["*"]
  - apiGroups: ["", "batch"] # <-- add new rule
    resources: ["jobs", "pods/log" ]
    verbs: ["get", "list",  "create", "delete"]
A second rule is added for ‘batch’ apiGroups. This allows the developer to run (and delete) this job. Under resources, ‘pods/log’ is added which allows logs to be viewed by developers.
Once we are done viewing the logs, we can delete this Job. If you do not care about the logs, it can be deleted automatically using .spec.ttlSecondsAfterFinished documented at https://kubernetes.io/docs/concepts/workloads/controllers/job/#clean-up-finished-jobs-automatically. However, it is a good idea to collect these logs to a centralised log system like Loki, ElasticSearch or Splunk. Otherwise, it will be gone forever.
# Run as 👷 developer

kubectl --context=dev-context delete jobs/migrate

# returns
job.batch "migrate" deleted
Migrate Down
Because we useENTRYPOINT in our yaml manifest file, we can overwrite what commands and flags we want to pass to this program. To do that we need to supply a combination of both command and args. command has not changed, but we can supply an array of arguments. The one we desire is migrate -go down so we give each cli argument as an item in the args array.
# k8s-devops/api/migrate-job.yaml

apiVersion: batch/v1
kind: Job
metadata:
  name: migrate-job
spec:
  template:
    spec:
      restartPolicy: Never
      containers:
        - name: migrate
          image: gmhafiz/migrate:6be26935ae705e3b1ff2b3e6210eb98b9182f0bf
          command: migrate
          args:
            - -go
            - down
          envFrom:
Then simply re-apply this yaml file to migrate down one level. The same Job cannot be run twice. So if you have not deleted the ‘migrate up’ Job we ran before, it it needs to be deleted first.
kubectl delete job migrate-job # if you have not run this
kubectl apply -f migrate-job.yaml
If you the above commands, do not forget to re-run the migrate up again lest you do not have a table in the database!
Service
The final thing to make api accessible by creating a Service object for this api. It is similar to database’s Service where we restrict it to TCP.
#  /k8s-devops/api/service.yaml

apiVersion: v1
kind: Service
metadata:
  labels:
    app: server
  name: server
spec:
  type: ClusterIP
  ports:
  - port: 3080
    protocol: TCP
    targetPort: 3080
  selector:
    app: server
Apply with
kubectl apply -f service.yaml
Confirm ‘server’ Service has been created and exposed at port 3080 with
kubectl get svc

#returns
NAME         TYPE        CLUSTER-IP      EXTERNAL-IP   PORT(S)    AGE
kubernetes   ClusterIP   10.96.0.1       <none>        443/TCP    17d
postgres     ClusterIP   10.105.21.101   <none>        5432/TCP   7d2h
server       ClusterIP   10.101.141.71   <none>        3080/TCP   139m
Access
Just like a database, let us try to SSH into one of the nodes and try hitting the /ready endpoint to confirm that the api can talk to the database.
ssh kubeadmin@172.16.16.201 # ip address of your node, and it depends on your setup
Then using the ClusterIP address we saw above,
curl -v 10.101.141.71:3080/ready

# returns
*   Trying 10.101.141.71:3080...
* Connected to 10.101.141.71 (10.101.141.71) port 3080 (#0)
> GET /ready HTTP/1.1
> Host: 10.101.141.71:3080
> User-Agent: curl/7.88.1
> Accept: */*
>
< HTTP/1.1 200 OK
< Access-Control-Allow-Headers: Accept, Content-Type, Content-Length, Authorization
< Access-Control-Allow-Methods: POST, GET, OPTIONS, PUT, DELETE
< Access-Control-Allow-Origin: *
< Date: Sun, 09 Jul 2023 10:26:57 GMT
< Content-Length: 0
<
* Connection #0 to host 10.101.141.71 left intact
It returns a 200 OK response which means the api can talk to the database! Notice that we use an IP address once we SSH into one of the nodes. The Pods themselves have an entry in their /etc/resolv.conf file to help the correct IP address when referencing using postgres host.
Inspect DNS
Unfortunately we cannot inspect the content of this /etc/resolv.conf file because our container’s base image is bare minimum — there’s no shell, cat, tail, nano, etc. What we can do is to use another base image that contain the necessary tools for debugging. Rebuild a new image using a ’normal’ base such as debian:12 instead of distroless.
Use debian:12 image and install curl (optionally netcat too)
#FROM gcr.io/distroless/static-debian11
FROM debian:12

RUN apt update && apt install -y curl netcat-traditional
Push the image and apply to your cluster. Grab any one of the newly created Pod names.
kubectl get po

# returns
NAME                        READY   STATUS    RESTARTS      AGE
postgres-867f96c9d8-wd9xh   1/1     Running   2 (76m ago)   6d
server-6b89f77d6c-r5ndr     1/1     Running   0             119s
server-6b89f77d6c-t5466     1/1     Running   0             2m19s
server-6b89f77d6c-xnsrk     1/1     Running   0             2m32s
web-7b84b7d46f-kxhgj        1/1     Running   4 (76m ago)   10d
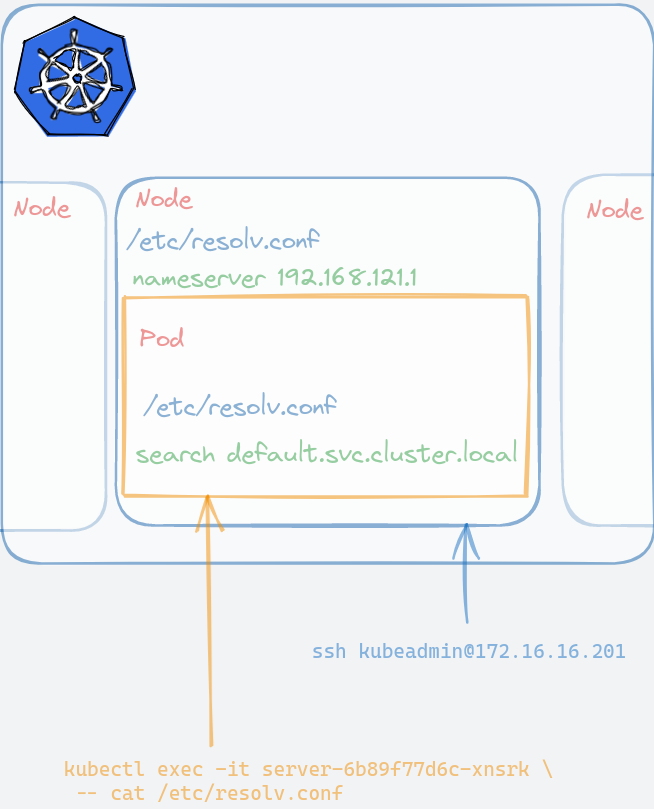
Inspect the Pod’s /etc/resolv.conf file. The -- passes the command we want to the Pod. As you can see, k8s added the entry for us automatically.
kubectl exec -it server-6b89f77d6c-xnsrk -- cat /etc/resolv.conf

# returns
search default.svc.cluster.local svc.cluster.local cluster.local
nameserver 10.96.0.10
options ndots:5
and now, you can query /ready endpoint using its DNS entry instead of IP address.
kubectl exec -it server-6b89f77d6c-xnsrk -- curl -v server.default.svc.cluster.local:3080/ready

# returns
*   Trying 10.101.141.71:3080...
* Connected to server.default.svc.cluster.local (10.101.141.71) port 3080 (#0)
> GET /ready HTTP/1.1
> Host: server.default.svc.cluster.local:3080
> User-Agent: curl/7.88.1
> Accept: */*
>
< HTTP/1.1 200 OK
< Access-Control-Allow-Headers: Accept, Content-Type, Content-Length, Authorization
< Access-Control-Allow-Methods: POST, GET, OPTIONS, PUT, DELETE
< Access-Control-Allow-Origin: *
< Date: Fri, 21 Jul 2023 08:55:27 GMT
< Content-Length: 0
<
* Connection #0 to host server.default.svc.cluster.local left intact
As you can see, the content of /etc/resolv.conf are different from the nodes’ and the Pod’s. Pod’s DNS entry is managed by k8s while nodes’ are left untouched. Not so magical after all once you figure out what k8s did behind the scene.
Frontend
To visualise and interact with the api, we will build a simple single-page application (SPA). Frontend is not the main focus in this post, so I will only share important snippets only. Full code is in https://github.com/gmhafiz/k8s-web.
The web is created using the wizard found in the Vue3 documentation site.
npm init vue@latest
We need a view to show our list of ten UUID, so we create a new Vue component under the Views directory. In it, we need a method that calls the api and stores the result in data(). The URL needs to be the same as the one we will port-forward the api. To automatically call this get() method, we call it when the page gets mounted.
interface Random {
    id: number,
    name: string
}

export default defineComponent({
    mounted() {
        this.get()
    },
    data() {
        return {
            randoms: [] as Random[],

            address: 'http://localhost:3080'
        }
    },
    methods: {
        async get() {
              this.randoms = await fetch(`${this.address}/randoms`)
                  .then((res => res.json()))
                  .catch((err) => {
                    console.error(err)
                  });
            },
To display, we simply loop over randoms variable. Because this is Typescript, we declare that it is going to be a Random data structure where each item has an ID and a name. We can display them using the dot notation.
<div v-for="item in randoms" :key="item.id" style="display: flex; font-family: monospace">
    <div style="min-width: 1.5rem;">
        {{ item.id }}
    </div>
    <div>
        : {{ item.name }}
    </div>
</div>
We also want a button that calls the api to add a new UUID just to show that connections can also go in. So we create a button so that on a click (@click), it calls the add() method with POST verb. On success, it will re-retrieve the latest ten UUIDs. Vue will take care of updating the UI, and it will show the latest data automatically. That’s right, all DOM manipulations are done magically. Of course, you can also make the POST request to return only the single created data and then append its result to the randoms variable instead of re-querying the list again.
<script lang="ts">
  methods: {
    add() {
      fetch(`${this.address}/randoms`, {
        method: "POST"
      })
          .then(() => {
            this.get()
          })
          .catch((err) => {
            console.error(err)
          })
    }
  }
</script>

<template>
    <div style="margin-top: 1rem; margin-bottom: 1rem;">
        <button
            style="padding: 0.5rem; background-color: rgba(72,154,238,0.79); color: rgb(255,255,255,0.86)"
            @click="add"
        >
          Add New UUID
        </button>
    </div>
</template>
Finally, we need to containerise this. Unlike our api program, this web UI needs a server that can serve this page because a folder on its own cannot serve itself. Something like nginx or caddy suffice. We continue to use multi-stage strategy like we have seen with api container build. Starting from the node image of version 18 (LTS version), we copy both package.json and its lock file (package-lock.json) and run npm install. In the second stage, we run nginx to serve static files from /usr/share/nginx/html. It is exposed at port 8080 which is the default port for this chainguard nginx image.
# k8s-web/Dockerfile

FROM node:18 as build-stage

WORKDIR /app

COPY package*.json ./
RUN npm install

COPY . .
RUN npm run build

FROM cgr.dev/chainguard/nginx:1.25.1 as production-stage

COPY --from=build-stage /app/dist /usr/share/nginx/html

EXPOSE 8080
To build, run the following command. Just replace gmhafiz/web with your own repository name if you are following along.
git commit -a -m "initial commit"
TAG=$(git rev-parse HEAD)
docker build -t gmhafiz/web:${TAG} .
Finally, push the resulting image to Docker hub.
docker push gmhafiz/web:${TAG}
Now as the devops, we only need to create two objects; a Deployment and a Service. Here we combine both Deployment and Service object in a single yaml file because these objects are logically grouped together (using --- as separator) and is recommended as a best practice. You can keep all db.yaml, api.yaml, and web.yaml in a single folder without worrying about file naming clashes, and finding them becomes a lot easier.
# k8s-devops/web/web.yaml

apiVersion: apps/v1
kind: Deployment
metadata:
  labels:
    app: web
  name: web
spec:
  replicas: 1
  selector:
    matchLabels:
      app: web
  template:
    metadata:
      labels:
        app: web
    spec:
      containers:
        - image: gmhafiz/web:e2adcb710ce2feb645b2a5c3799d67e6d9554631
          name: web
          resources:
            limits:
              cpu: "500m"
              memory: "128Mi"
Two important bits are as follows. The first id .spec.template.metadata.labels.app which we labelled as web This is the label that our Service is going to refer to. Finally, we have a single container with the tagged image name.
To expose this Deployment, we need a Service object. The image exposes the web application at port 80 denoted by .spec.ports[0].port. We use targetPort for us to find this Deployment which happens to be the same number. .spec.selector.app is important because that is how this Service is going to find our Deployment above.
# k8s-devops/web/web.yaml

---
apiVersion: v1
kind: Service
metadata:
  labels:
    app: web
  name: web
spec:
  type: ClusterIP
  ports:
    - port: 80
      protocol: TCP
      targetPort: 80
  selector:
    app: web
Apply with
kubectl apply -f web.yaml
Port Forward
This brings us to the last piece of this post which is port-forwarding. This technique forwards requests we make from the local computer into the k8s cluster. We only need to port-forward both api and the web. It is not necessary to port-forward the database because we do not interact directly with it. While this port-forward technique is sufficient right now, in a real-world application, you would want an Ingress instead.
To port-forward the api, we use port-forward sub-command followed by Service name. The last part of port number mapping is a bit unintuitive - it follows a <local>:<k8s> format meaning we want to map port 8080 exposed from k8s web Service to port 8080 in our local computer.
At this stage you should have two Services running in the cluster, one each for api and server.
kubectl get svc

#returns
NAME         TYPE        CLUSTER-IP       EXTERNAL-IP   PORT(S)    AGE
kubernetes   ClusterIP   10.96.0.1        <none>        443/TCP    18d
postgres     ClusterIP   10.105.21.101    <none>        5432/TCP   8d
server       ClusterIP   10.101.141.71    <none>        3080/TCP   30h
web          ClusterIP   10.109.238.205   <none>        8080/TCP   50s
To port forward run each of the following command in its own terminal
kubectl port-forward svc/web 8080:8080

# returns
Forwarding from 127.0.0.1:8080 -> 8080
Forwarding from [::1]:8080 -> 8080
kubectl port-forward svc/server 3080:3080

# returns
Forwarding from 127.0.0.1:3080 -> 3080
Forwarding from [::1]:3080 -> 3080
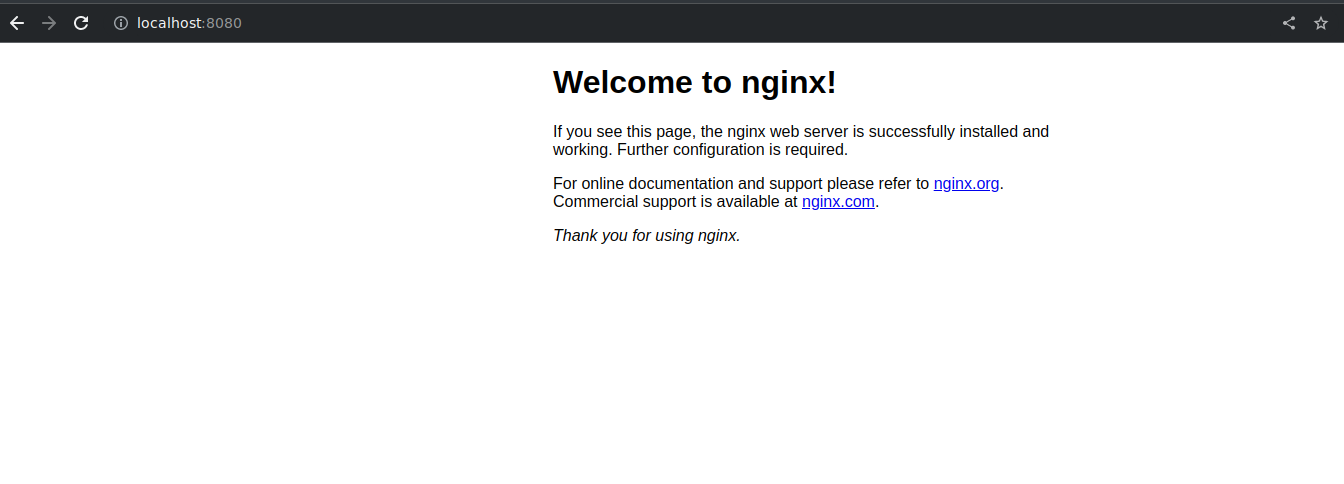
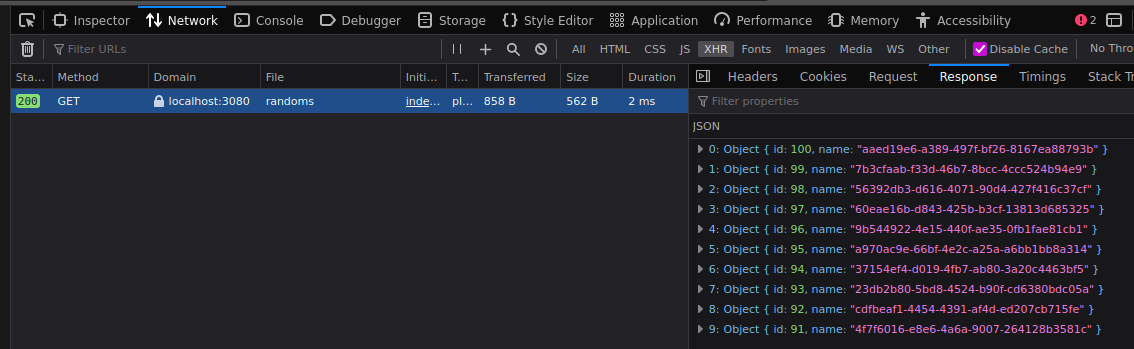
Now open your browser at http://localhost:8080, and you will see a Vue single-page application with ten UUIDs on the right!
If you look over the network tab, you can see this SPA sends a request to localhost port 3080. This request is then forwarded into the k8s cluster.
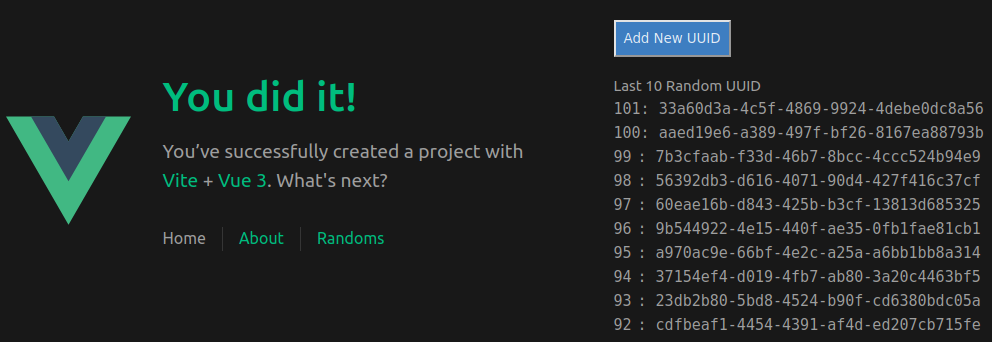
To reiterate that the api can communicate with database, let us add a new UUID by clicking the Add button:
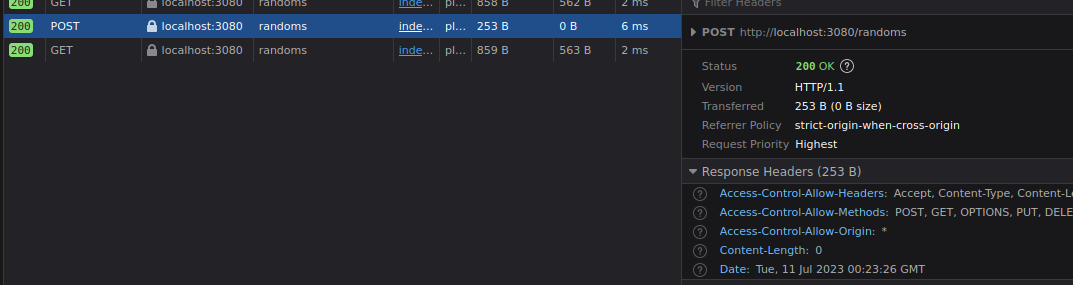
A POST request was made and it re-retrieves the latest ten UUIDs which includes a new 101-th UUID.
CORS
Before we finish, let us make an adjustment to the api, so it only accepts api requests from http://localhost:8080 In the k8s-api repository, open cmd/api/main.go and restrict allowed incoming requests from everything using asterisk (*) to http://localhost:8080.
@@ -57,7 +58,7 @@
 }

 func enableCors(w *http.ResponseWriter) {
-	(*w).Header().Set("Access-Control-Allow-Origin", "*")
+	(*w).Header().Set("Access-Control-Allow-Origin", "http://localhost:8080")
 	(*w).Header().Set("Access-Control-Allow-Methods", "POST, GET, OPTIONS, PUT, DELETE")
 	(*w).Header().Set("Access-Control-Allow-Headers", "Accept, Content-Type, Content-Length, Authorization")
 }
Whenever there is a mismatch between originating URL and api server, the browser will attach additional headers and sends an OPTION HTTP request, and if successful, it will continue with the intended API call. Our server already returns those three headers anyway to help browser to decide whether to continue doing the API call or not.
Commit and build a new image. Then push to container registry. There will be a new $TAG so this value needs to be applied to container image and yaml file.
git commit -a -m "cors restriction"
TAG=$(git rev-parse HEAD)
docker build -f Dockerfile-api -t gmhafiz/api:$TAG .
docker push gmhafiz/api:${TAG}
In the devops repository, edit server’s image tag, so it will deploy our new image
vim k8s-devops/api/server.yaml
    spec:
      containers:
      - image: gmhafiz/api:7f7bec15ce619a43a2ecb75dc3d56673322174f5 # <-- different tag
Simply apply this file and k8s will do its magic of rolling out new Deployment in the k8s cluster.
kubectl apply -f server.yaml
Once that is done, you will see everything still work the same.
To confirm that CORS is working, let us change the port our local port forward is listening to something other than 8080. Press Ctrl+C to terminate web’s port forward and pick another port, for example 8081.
kubectl port-forward svc/web 8080:8080

Forwarding from 127.0.0.1:8080 -> 8080
Forwarding from [::1]:8080 -> 8080
Handling connection for 8080
Handling connection for 8080
^C

kubectl port-forward svc/web 8081:8080

Forwarding from 127.0.0.1:8081 -> 8080
Forwarding from [::1]:8081 -> 8080
Instead of http://localhost:8080, open http://localhost:8081 and you will see no api requests are working anymore! Open network tab and you will see a CORS error.

Further investigation shows that the browser sends ‘Origin: http://localhost:8081’ which is not in the allowed origin set in CORS settings in our api.
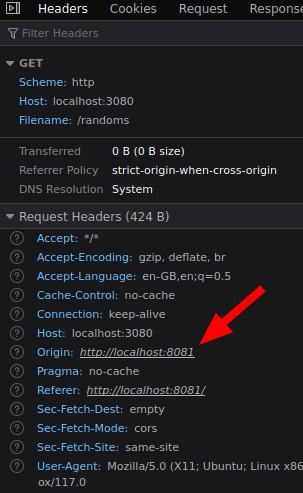
Calling the api using curl will continue to work. CORS only applies between browsers and servers because your browser first sends an OPTION HTTP request before doing a GET HTTP verb.
Conclusion
You have learned how to create three applications, database, api server, and a web single-page application and containerise and push each of them to a container registry. Database was deployed with extra authorizations steps. The API server was deployed in a more cloud-native way by following many of 12-factor app principles. Then, using k8s yaml manifest files, we deploy each of them into the cluster and expose them as service. Finally, port-forwarding allows us to access both api and web applications.
As you can see, a handful of yaml files were enough to deploy all three applications. Yaml files can be logically combined which makes it only three yaml files to manage. SealedSecret object needed an extra step to create though.
What is next? In real-life production settings, it is a very good idea to use a managed database solution instead of having the database in the cluster like this. There’s no TLS anywhere in between the applications so it is not secure thus that needs to be remediated. Finally, the applications we have here cannot be accessed from the Internet yet. That is what the next part is for which is Ingress which I hope will be the shortest of this three-part blog series ;)
References
- https://kubernetes.io/docs/ kubernetes main documentation
- https://stackoverflow.com/a/56552938/1033134 ASCII trick
- https://docs.bitnami.com/tutorials/configure-rbac-in-your-kubernetes-cluster/ RBAC
Further Reads
- https://12factor.net/config - best practices of application deployment
- https://home.robusta.dev/blog/stop-using-cpu-limits Setting CPU requests might be better than restricting using CPU limits
 Kubernetes… everyone’s favourite container orchestration. Love or hate it, it is fast becoming
the de-facto solution for managing containers at scale. This blog post will go through step by
step on how we can create a kubernetes (k8s) cluster on a local machine from the first command
to all nodes being ready in about 12 minutes. This post assumes the readers to have basic knowledge
of k8s. If you haven’t heard of k8s, you should read
Kubernetes… everyone’s favourite container orchestration. Love or hate it, it is fast becoming
the de-facto solution for managing containers at scale. This blog post will go through step by
step on how we can create a kubernetes (k8s) cluster on a local machine from the first command
to all nodes being ready in about 12 minutes. This post assumes the readers to have basic knowledge
of k8s. If you haven’t heard of k8s, you should read