How To Use OpenTelemetry in Laravel 11
Introduction
Laravel is a popular open source PHP framework for rapid web application development. It features many tools out of the box such as developing simple API, full-stack development, background job processing, authentication and authorisation, and it has a powerful object-relation-mapper (ORM) to deal with database data interaction. It prefers conventions over configuration to let you focus on coding and get things done.
Observability is a technique of how we gain insight on a program’s internal state. We create, or instrument, three signals called metrics and traces and logs that work together to gain an understanding on how applications perform and behave. Amongst information we can obtain are which API endpoint is slow and which ones are most popular. Errors can happen. When it does, we want to know exactly where it is even if we have applications split into microservices. All logs are centralised and easily searchable making debugging a production application a breeze.
One such observability tool we can use is an open source project called OpenTelemetry. It is a set of tools, APIs, and, SDKs that make up this open observability ecosystem. As a bonus, it is vendor-neutral by nature which means you are free to mix and match between tools and companies. Fortunately for us, its SDK includes PHP. The OpenTelemetry PHP section details what you need in order to install OpenTelemetry in your computer environment. It lists three requirements which are PHP 8.0+, pecl, and composer. Under automatic instrumentation, there are a series of commands to add OpenTelemetry for Slim framework and generic PHP application in general. There isn’t any specific instructions for Laravel so we need to rely on bits and pieces of information scattered around the official documentation and other places.
This blog post intends to be a one-page best effort reference to install OpenTelemetry to a Laravel application complete with a dashboard in Grafana. I have been writing this since March this year and I feel vindicated showing the long form (as I often have in this blog) when I saw a recent survey saying that more than 60% users are saying they want detailed tutorials and reference implementation to instrument OpenTelemetry into their application.
We will build a fully instrumented Laravel from scratch step by step. Then we explore how to make sense of all data(signals) using a Grafana dashboard. However, I did not achieve everything I wanted. Running the server with Swoole does not transmit traces reliably. OpenTelemetry metrics library does not have with internal state storage which requires us to use another library to compensate. Nevertheless this is a good starting point to build upon.
By the end of this post, you will have a basic starting point towards observability and I hope you will gain an appreciation of how useful OpenTelemetry can be for your Laravel application.
Table of Contents
- Architecture
- New Laravel 11 Project
- Prepare Server
- Instrument
- Infrastructure
- Explore Grafana Dashboard
Architecture
Before diving into automatic instrumentation, let us view a high-level architecture of what we will be building. Tracing is going to be instrumented using OpenTelemetry automatic instrumentation using official PHP SDK. Tracing signals are sent from Laravel to otel-collector where it is processed, and then emitted to supported backend storage and viewer, in our case Jaeger.
We choose Prometheus, which is a time-series database to store metrics data. Because of the nature of typical PHP program following a share-nothing request lifecycle, metrics data such as counters cannot be remembered(stored) between requests. This causes counters to always reset to zero. The official OpenTelemetry PHP SDK does not come with a storage adapter (nor it intends to). For this reason, we are going to instrument metrics using Prometheus’ library instead that supports storing data such as APCu or Redis. Looking at the architecture diagram below, you also notice that the arrow is from right to left because Prometheus is going to pull metrics data instead of Laravel sending data to Prometheus.
For logs, we use Promtail to tail logs created by Laravel and send them to Loki, which is a log aggregation system. OpenTelemetry SDK already comes with log support and it also can send logs to Loki. It may be the preferable way because the fewer components we need to deal with the better. I am demonstrating one more way just to show you can be flexible in implementing this.
Grafana is our visualisation platform that gives us a dashboard to not only give us a quick glance on how our application is doing, but also perform investigative work. To demonstrate, synthetic load is needed. Finally Postgres is used to demonstrate OpenTelemetry SDK capability of capturing database queries and Redis is used to store metrics data between requests.

New Laravel 11 Project
This section offers several approaches to getting or creating this project.
-
If you already have one running, skip to Prepare Server section.
-
If you want an already instrumented Laravel api, follow instructions in https://codeberg.org/gmhafiz/observability and skip to Explore Grafana Dashboard
-
If you prefer to start from scratch, follow the instructions below.
You require composer to be installed to create a new Laravel 11 project. Let us simply name the project as laravel,
sudo apt install composer
Before Laravel can be installed, you may need several PHP packages beforehand.
sudo apt install php-{mbstring,curl,dom,pgsql,xml}
The following command creates a new Laravel project.
composer create-project laravel/laravel:^11.0 laravel
cd laravel
We want to demonstrate that SQL query statements are included in tracing. Thus, I highly recommended setting up a database. If you already have it running, edit your environment variables to reflect correct values accordingly.
vim .env
DB_CONNECTION=pgsql
DB_HOST=127.0.0.1
DB_PORT=5432
DB_DATABASE=laravel
DB_USERNAME=postgres
DB_PASSWORD=password
If you prefer the container way, Postgres database can be created in one line. Then edit your .env accordingly.
docker run --name postgres_db --restart=always -e POSTGRES_PASSWORD=password --publish 5432:5432 -d postgres:17
It takes a few seconds for the database to be up. When it does, create a new database.
docker exec -it postgres_db psql -U postgres -c "CREATE DATABASE laravel;"
If you have not got Redis yet, this is a good place to bring that up using a Redis replacement called Valkey.
docker run --name redis --restart=always --publish 6379:6379 -d valkey/valkey:7.2
Laravel requires a few tables to be created so run database migrations with:
php artisan migrate
Setup is now complete so let us run a quick php web server with
php artisan serve
Open http://localhost:8000 and you should see Laravel’s initial page. If you get a ‘No application encryption key has been specified’, that is because APP_KEY environment variable is empty. Generate one with:
php artisan key:generate
Voila! If you see the following screenshot on your browser, it means you have successfully installed an initial Laravel application.

Small API
Let us create one api that calls the database. If you are working with an existing project, you can skip to the Infrastructure section.
Laravel 11 does not come with traditional API in default installation but enabling it is only one command away.
php artisan install:api
Before we write our API and controller, let us create mock data. To generate them, we use a seeder. Open database/seeders/DatabaseSeeder.php and create a thousand mock users.
<?php

namespace Database\Seeders;

use App\Models\User;
use Illuminate\Database\Seeder;

class DatabaseSeeder extends Seeder
{
    /**
     * Seed the application's database.
     */
    public function run(): void
    {
        User::factory(1000)->create();
    }
}
Once you are happy with the seeder, run it with db:seed artisan command.
php artisan db:seed
To create our controller, we take advantage of artisan command to scaffold a typical User controller
php artisan make:controller UserController -r
In our User controller at app/Http/Controllers/UserController.php, we return a random number of users. The reason is so we see varied metrics data which we will see in Grafana dashboard later. Note that we could have used eloquent but we aren’t doing anything fancy with this query.
use Illuminate\Support\Facades\DB;
use Illuminate\Support\Facades\Log;

class UserController extends Controller
{
    /**
     * Display a listing of the resource.
     */
    public function index()
    {
        Log::info('in user controller');

        $amount = mt_rand(1, 1000);
        Log::debug('random amount is: ' . $amount);

        return DB::table('users')
            ->select(['id', 'name', 'email', 'email_verified_at', 'created_at', 'updated_at'])
            ->orderByDesc('id')
            ->limit($amount)
            ->get();
    }
Make sure we register the /api/users route in routes/api.php
<?php

use App\Http\Controllers\UserController;
use Illuminate\Http\Request;
use Illuminate\Support\Facades\Route;

Route::resource('users', UserController::class); // <-- add this line and its imports
We are now ready to test this endpoint. Simply do a curl to confirm that the API is working as intended.
curl http://localhost:8000/api/users
You should be getting a json response like this
[
    {
      "id": 100,
      "name": "Jovan Rosenbaum",
      "email": "manuel.pacocha@example.com",
      "email_verified_at": "2024-03-20T07:54:31.000000Z",
      "created_at": "2024-03-20T07:54:31.000000Z",
      "updated_at": "2024-03-20T07:54:31.000000Z"
    },
    {
    ...etc
~~
As you can see, developing an endpoint is simple which involved a simple query builder and defining an API endpoint for it. Of course, real-world application involves authentication, authorisation, request validation, output JSON formatting, testing, and more but those are not the focus of this post.
Prepare Server
Before installing OpenTelemetry packages for Laravel, your computer needs to be set up with a PHP extension called opentelemetry. Your operating system may come with an easy way to install it. Regardless, I am showing you the pecl way.
Please note that a lot of preparing the server PHP headache can be avoided if you had used containers instead. But it may not be an option so a long way is demonstrated here.
If you have not got pecl installed yet, install using these two packages.
sudo apt install php-pear php-dev
Then simply use pecl to install opentelemetry.
sudo pecl install opentelemetry
Since PHP requests cannot remember values between requests thanks to its share-nothing model, accumulating number of requests cannot be done without storing the value somewhere. OpenTelemetry SDK does not define a way to do this so we have to resort to a different library to capture metrics. It defaults to Redis for storage but you can also use APCu to store metric values between requests.
# optional
sudo pecl install apcu
To enable these extension, we need to add them to our php.ini file. The best way is to add inside conf.d directory.
echo "extension=opentelemetry" | sudo tee -a /etc/php/8.2/cli/conf.d/20-opentelemetry.ini

# optional
echo "extension=apcu" | sudo tee -a /etc/php/8.2/cli/conf.d/20-apcu.ini
Finally, install the Redis PHP extension.
sudo apt install php-redis
Always confirm that the extension is enabled. Check with:
php -m | grep "opentelemetry\|apcu\|redis"
No matter what linux distribution or operating system you use, the output must display the installed php extension.
opentelemetry
apcu
redis
Installing a PHP extension is probably the hardest part of this whole post and there are no short of tools out there to try simplify things up like Homestead, Valet, Herd, devcontainer, Sail, etc. Worth mentioning that it is also recommended to install some optional extensions especially mbstring, grpc, and protobuf.
Settings
OpenTelemetry settings can be controlled using environment variables. Open .env and add following lines. Note that this is not an exhaustive list. The OpenTelemetry SDK are set with some default settings which you can overwrite.
OTEL_PHP_AUTOLOAD_ENABLED=true
OTEL_SERVICE_NAME=laravel

OTEL_EXPORTER_OTLP_ENDPOINT=http://localhost:4318
OTEL_EXPORTER_OTLP_PROTOCOL=http/json

OTEL_TRACES_EXPORTER=otlp
OTEL_METRIC_EXPORTER=none
OTEL_LOGS_EXPORTER=otlp

OTEL_TRACES_SAMPLER_ARG=1
At a minimum, OTEL_PHP_AUTOLOAD_ENABLED must be set to true. I highly recommend setting the endpoint and protocol to emit OpenTelemetry data. In our case we use port 4318 and it emits the data in a JSON format. If you can, use port 4317 to send data through grpc protocol instead
The rest are optional but let us take a look at what we can customise.
Setting a service name identifies the signals generated from this particular application. This is useful when we need to differentiate between services, say a nodejs app, or SpringBoot against Laravel.
When it comes to exporting the signals, note that OTEL_METRIC_EXPORTER is disabled because we are going to use a Prometheus library for metrics generation.
Traces are typically sampled because a lot of them are identical and we do not need identical data points. For that reason, the value is often set at a low value such as 0.1. In our case, we set it to 1 because we want see all of traces that were generated for demonstration purpose. To learn more about these settings, visit https://opentelemetry.io/docs/languages/sdk-configuration/
Instrument
Instrumenting is enabling our application to be able to produce the three signals—tracing, metrics, and logs—into our application. It involves installing necessary packages through composer and where necessary, add some codes into the codebase so it can generate these signals to be consumed elsewhere.
Tracing
We instrument tracing using OpenTelemetry by installing several packages. First, enable composer autoloading because this is how OpenTelemetry SDK will be able to automatically register itself to Laravel. By default, Laravel already has this setting enabled. But to be sure, run this line:
composer config allow-plugins.php-http/discovery true
Check composer.json and the “php-http/discovery” value should be true.
"config": {
    "optimize-autoloader": true,
    "preferred-install": "dist",
    "sort-packages": true,
    "allow-plugins": {
        "pestphp/pest-plugin": true,
        "php-http/discovery": true <-- auto discovery
    }
},
Now we are ready to install packages for OpenTelemetry auto-instrumentation. open-telemetry/sdk is the main package we need. It implements OpenTelemetry API so telemetry data are generated in the correct format. The open-telemetry/exporter-otlp package exports that data over the wire in OTLP format. Which means guzzle packages is needed to perform any network calls. The opentelemetry-auto-laravel package automatically hooks into your Laravel request-response lifecycle to generate the signals automatically.
If you want to track requests between microservices, we want to handle W3C trace context propagation. This context passes around one trace ID between microservices so we can track request lifecycle across all services. For that we need to install both PSR15 and PSR18 packages to handle incoming and outgoing HTTP requests respectively.
composer require open-telemetry/sdk
composer require open-telemetry/exporter-otlp
composer require guzzlehttp/guzzle
composer require php-http/guzzle7-adapter
composer require open-telemetry/opentelemetry-auto-laravel

# for distributed tracing
composer require open-telemetry/opentelemetry-auto-psr15
composer require open-telemetry/opentelemetry-auto-psr18
composer require open-telemetry/opentelemetry-auto-guzzle
Optionally, we can attach logs to each trace by instrumenting monolog which is the package Laravel uses for logging. The advantage of using this way is we let OpenTelemetry SDK does the automatic correlation of logs to a trace.
composer require \
  monolog/monolog \
  open-telemetry/opentelemetry-logger-monolog
If you choose gRPC to send the data, install an additional package. The gRPC PHP extension is required. Make sure that the gRPC version installed by composer is the same as the version you install with pecl.
composer require grpc/grpc@1.57.0
sudo pecl install grpc-1.57.0
composer require open-telemetry/transport-grpc
Then switch to gRPC transport.
# .env
#OTEL_EXPORTER_OTLP_ENDPOINT=http://0.0.0.0:4318
#OTEL_EXPORTER_OTLP_PROTOCOL=http/json
OTEL_EXPORTER_OTLP_ENDPOINT=http://localhost:4317
OTEL_EXPORTER_OTLP_PROTOCOL=grpc
Our chosen architecture on the other hand does a bit more as detailed down below. We choose a log pusher system called Promtail to push the logs to a log aggregator called Loki. This completely bypasses otel-collector. The downside is these logs won’t be correlated with a trace by default so additional work need to be done in order to correlate logs to a trace which will be explained in the Logs section.
Nesting Traces
Up until now, our Laravel application has been instrumented for tracing automatically thanks to open-telemetry/opentelemetry-auto-laravel package. However, this package only creates one trace for each request. That’s cool, but typically we do not code everything in a controller class only. Plus, it is more interesting to see trace and spans grouped by child functions so it becomes logical. For example, we could relegate database calls to a repository or service class on another function. This function can call yet another function and as a result, you get a tree-like structure of your request. This brings us an opportunity to not only scope the timing between your functions, but also the timing of a group of child functions!

To achieve this, we can either pass around $trace instance around as function parameter, or re-retrieve this $tracer through a provider in each child class. In the user controller—app/Http/Controllers/UserController.php—, obtain the trace that was created by auto-instrumentation and create a new span. A tracer is obtained from a global default. A span is created by giving a name (I prefer using function’s name) from spanBuilder()->startSpan(). Then it needs to be activated to signify this span is scoped for this function. It does look strange that creating a span does not activate it but this is what the API spec is saying in languages with implicit Context propagation like PHP.
use Illuminate\Http\Request;
use OpenTelemetry\API\Globals;

public function index(Request $request)
{
    $tracer = Globals::tracerProvider()->getTracer('io.opentelemetry.contrib.php');
    $root = $tracer->spanBuilder('index')->startSpan();
    $scope = $root->activate();
Then in each child function, you do the same three lines of code—re-retrive $tracer from a global provider.
If you do not prefer that way, the $tracer instance can be passed from parent into child classes as a function parameter.
// pass $tracer to child function
$this->userRepo->all($tracer);
Finally both $root and $scope need to be closed. A detach() resets the Context associated with this scope while end() signals that this span operation has ended.
$scope->detach();
$root->end();
It is a little bit of work because at least four lines of code need to be added to each function in order to obtain nested spans. Unlike auto-instrumentation in Java, nested spans are added automatically into each function without writing a single line of code. On a flip side, you might not want to create spans for every single function because you might not care about instrumenting certain function.
Before closing off this section, another modification I like is to do is to wrap instrumenting code in a try..finally block where both detach() and end() are moved into the finally block to ensure they are always run.
Metrics
OpenTelemetry SDK supports all three signals for PHP but we opt for Prometheus library to instrument metrics instead because of its additional important feature. The Prometheus library has an internal state storage capability to remember metrics data between requests which OpenTelemetry SDK lacks but is under investigation. Having things like Swoole or Roadrunner might help because Laravel application is held running constantly instead of having to reboot for each request but I haven’t been able to make OpenTelemetry work with it reliably yet.
Nevertheless, install Prometheus client with following command. As always, full code is at https://codeberg.org/gmhafiz/observability/src/branch/master/laravel
composer require promphp/prometheus_client_php
To generate metrics data, we intercept each requests using a middleware. We will be writing a custom middleware that will intercept each request latency grouped by HTTP method and URI path.
To create a middleware in Laravel:
php artisan make:middleware PrometheusMiddleware
Open app/Http/Middleware/PrometheusMiddleware.php and in handle() function, we measure the latency from the first time Laravel boots up until the request has been handled. To do this, we sandwich $next($request) with microtime(true). The resulting difference is multiplied by one thousand because we want the unit to be in millisecond unit.
public function handle(Request $request, Closure $next): Response
{
    $startTime = defined('LARAVEL_START') ? LARAVEL_START : $request->server('REQUEST_TIME_FLOAT');

    $result = $next($request);

    $duration = $startTime ? ((microtime(true) - $startTime) * 1000) : null;
I am simply going to record one kind of metric which is a histogram. The histogram buckets consist of different api routes based on its latency. This means, we will have exponential buckets for /api/users at defined by Histogram::exponentialBuckets(1, 2, 15). These buckets are further differentiated with HTTP method because we are interested to know metrics from a GET to a PUT. All of them are labelled with a string ‘Laravel’ to identify this application(job). Just like the user controller, I like putting this block of code in a try..catch..finally block because in the code block below, there are at least five things that can go wrong.
use App\Http\Controllers\Controller;
use Prometheus\CollectorRegistry;
use Prometheus\Histogram;

public function handle(Request $request, Closure $next): Response
{
    ...

    $registry = $this->registry;

    $method = $request->method();
    $uri = $request->route()->uri();

    try {
        $histogram = $registry->getOrRegisterHistogram(
            'http_server_duration',
            'milliseconds',
            'latency histogram grouped by path in milliseconds',
            ['job', 'method', 'path'],
            Histogram::exponentialBuckets(1, 2, 15),
        );
    finally {
        $histogram->observe($duration, ['Laravel', $method, $uri]);

        return $result;
    }
}
To finish off setting up this middleware, let us take a look at its configuration. Prometheus library uses Redis storage as default so its collector registry can be accessed using \Prometheus\CollectorRegistry::getDefault(). However, you may want to configure the address to Redis, or you may be satisfied with only APCu. We also need an instance of CollectorRegistry that we can use in both here in this middleware, and /api/metrics endpoint which we will build in a moment. Laravel 11 added another(new) way to register our class instantiation which can be confusing. I found it hard to figure out the changes that came with Laravel 11 even with the documentation so I hope the following not only helps with configuring Prometheus storage adaptor, but also using Providers in Laravel 11 in general.
Let us start with step 1 which is to create a new Provider. This creates a file in app/Providers/PrometheusProvider.php and a new entry in bootstrap/providers.php is added. You no longer need config/app.php for registering class anymore.
php artisan make:provider PrometheusProvider
In register() function, we register CollectorRegistry class as a singleton and give its Redis storage adaptor as argument. The values for Redis configuration comes from config() global helper which takes values from config/database.php.
use Prometheus\CollectorRegistry;
use Prometheus\Storage\Redis;

public function register(): void
{
    $this->app->singleton(CollectorRegistry::class, static function () {
        $redis = new Redis([
            'host' => config('database.redis.default.host') ?? 'localhost',
            'port' => config('database.redis.default.port') ?? 6379,
            'password' => config('database.redis.default.password') ?? null,
            'timeout' => 0.1, // in seconds
            'read_timeout' => '10', // in seconds
            'persistent_connections' => config('database.redis.default.persistent', false),
        ]);

        return new CollectorRegistry($redis);
    });
}
Once we have this CollectorRegistry class, our middleware can access it by injecting this CollectorRegistry class as a dependency through its constructor. Reopen the middleware at app/Providers/PrometheusProvider.php and add this constructor
use Prometheus\CollectorRegistry;
use Prometheus\Storage\Redis;

class PrometheusMiddleware
{
    private CollectorRegistry $registry;

    public function __construct(CollectorRegistry $registry)
    {
        $this->registry = $registry;
    }
Our Prometheus middleware is complete but it won’t be triggered in each request until is it registered with Laravel. To make Laravel intercept all requests with our Prometheus middleware, we add it in Laravel bootstrap handler. Open bootstrap/app.php and add the following line.
use App\Http\Middleware\PrometheusMiddleware;

return Application::configure(basePath: dirname(__DIR__))
    ->withRouting(
        web: __DIR__.'/../routes/web.php',
        api: __DIR__.'/../routes/api.php',
        commands: __DIR__.'/../routes/console.php',
        health: '/up',
    )
    ->withMiddleware(function (Middleware $middleware) {
        $middleware->append(PrometheusMiddleware::class); // <-- our custom handler
    })
    ->withExceptions(function (Exceptions $exceptions) {
        //
    })->create();
The last step we need to do is to allow Prometheus service to scrape metrics data from Laravel. To do this, we expose an API endpoint that returns this metrics data.
Create a new controller and open the file at app/Http/Controllers/Metrics/MetricsController.php.
php artisan make:controller Metrics/MetricsController
The index() function returns metrics data in Prometheus’ plaintext format.
<?php

namespace App\Http\Controllers\Metrics;

use Prometheus\CollectorRegistry;
use Prometheus\RenderTextFormat;

class MetricsController extends Controller
{
    private CollectorRegistry $registry;

    public function __construct(CollectorRegistry $registry)
    {
        $this->registry = $registry;
    }

    public function index()
    {
        $renderer = new RenderTextFormat();
        $result = $renderer->render($this->registry->getMetricFamilySamples(), true);

        header('Content-type: '.RenderTextFormat::MIME_TYPE);
        echo $result;
    }
}
To expose a /metrics endpoint, open routes/api.php file and add the following route.
use App\Http\Controllers\Metrics\MetricsController;

Route::get('/metrics', [MetricsController::class, 'index']);
In a production setting, you would want to protect this route by adding some authentication.
Logs
We could stop right here. Only metrics and tracing are needed to be instrumented because logs were already instrumented alongside trace(in OTLP format) because we have installed open-telemetry/opentelemetry-logger-monolog package.
However, from our chosen architecture, emitting logs are independent of Laravel and OpenTelemetry. My approach is to have some kind of an agent or log pusher like FluentBit or Promtail that pushes the logs from Laravel log files to a centralised datastore in a system like Loki. 12-factor app says logs should be treated as a stream and you should write them to stdout. We certainly can configure Laravel to log to stdout. The advantage of doing this way is we do not have to not have to worry about Laravel using disk I/O for writing logs. But the downside is you have another tool to install, configure, and maintain.
Keep in mind that logs that get instrumented in OTLP format has the advantage of being correlated with traces automatically thanks to unique trace ID present in both trace and log. This unique ID is absent in default Laravel log system. To achieve similar things, we will attempt something close which is by attaching the trace ID to each log. To do this, we need to write a custom Laravel log formatter.
Custom Laravel Log
When any log is called, our custom class intercepts the log handler and format it to our desire. Trace ID can be acquired from the global trace provider. All is left is to place where we want the trace ID in our formatted string.
Create a file in app/Logging/Loki.php and add the following code.
<?php

namespace App\Logging;

use Illuminate\Log\Logger;
use Monolog\Formatter\LineFormatter;
use OpenTelemetry\API\Globals;

class Loki
{
    public function __invoke(Logger $logger): void
    {
        $traceID = $this->getTraceID();

        foreach ($logger->getHandlers() as $handler) {
            $handler->setFormatter(new LineFormatter(
                "[%datetime%] %channel%.%level_name%: ".$traceID." %message% %context% %extra%\n"
            ));
        }
    }

    private function getTraceID(): string
    {
        $tracer = Globals::tracerProvider()->getTracer('');
        $root = $tracer->spanBuilder('')->startSpan();

        return $root->getContext()->getTraceId();
    }
}
What is left is to make Laravel use our newly created custom log formatter. Go to config/logging.php and find a channel for ‘single’. Add the following line with its import.
use App\Logging\Loki;

'single' => [
    'driver' => 'single',
    'tap' => [Loki::class], // <-- add this line
    'path' => storage_path('logs/laravel.log'),
    'level' => env('LOG_LEVEL', 'debug'),
    'replace_placeholders' => true,
],
The result is a log line that looks like this. Now that we have the trace ID, we can filter for this string and retrieve all logs scoped to a request!
[2024-04-07T11:19:40.975030+00:00] local.INFO: d550726cabd8b98ea5137ab6d73f6aa9 random amount is [66] []
JSON log
Line formatter is great although I prefer structured logs myself. Fortunately customising a log formatted to JSON is easy. To do so, we create a class that extends NormalizeFormatter. We have free reign on what fields we want to insert including a more precise timestamp, application name, and environment. Application name is useful to differentiate between different application logs. Including environment value can be useful when you mix together production and staging logs in your centralised log system. Then, a call to toJson() function formats our log object into a json log line.
Create a file at app/Logging/CustomJson.php with the following content.
<?php

namespace App\Logging;

use Monolog\Formatter\NormalizerFormatter;
use Monolog\LogRecord;

class CustomJson extends NormalizerFormatter
{
    private string $traceID;

    public function __construct($traceID = '')
    {
        parent::__construct('Y-m-d\TH:i:s.uP');

        $this->traceID = $traceID;
    }

    public function format(LogRecord $record): string
    {
        $recordData = parent::format($record);

        $message = [
            'datetime' => $recordData['datetime'],
        ];

        if (isset($this->traceID)) {
            $message['traceID'] = $this->traceID;
        }

        if (isset($recordData['message'])) {
            $message['message'] = $recordData['message'];
        }

        if (isset($recordData['level'])) {
            $message['level'] = $recordData['level'];
        }

        if (\count($recordData['context']) > 0) {
            $message['context'] = $recordData['context'];
        }

        if (\count($recordData['extra']) > 0) {
            $message['extra'] = $recordData['extra'];
        }
        $message['extra']['hostname'] = (string) gethostname();
        $message['extra']['app'] = config('app.name');
        $message['extra']['env'] = config('app.env');

        return $this->toJson($message)."\n";
    }
}
Then a small adjustment need to be made in app/Logging/Loki.php file so it uses our new custom formatter.
foreach ($logger->getHandlers() as $handler) {
    if (config('logging.json_format')) {
        $handler->setFormatter(new CustomJson($traceID));
    } else {
        $handler->setFormatter(new LineFormatter(
            '[%datetime%] %channel%.%level_name%: '.$traceID." %message% %context% %extra%\n"
        ));
    }
}
Since we use the global config() helper function, we need to define this in config/logging.php file.
<?php

use App\Logging\Loki;
use Monolog\Handler\NullHandler;
use Monolog\Handler\StreamHandler;
use Monolog\Handler\SyslogUdpHandler;
use Monolog\Processor\PsrLogMessageProcessor;

return [

    /*
     * Whether to format log output as a normal single line key value or switch to a JSON format
     */
    'json_format' => env('LOG_JSON', false),

... cut for brevity
The result is a log output but formatted as JSON.
{
    "datetime": "2024-10-06T22:42:37.307234+00:00",
    "traceID": "d4a890b60f7f705f5e6c34f4144df925",
    "level": 200,
    "message": "random amount is ",
    "context": [
        11
    ],
    "extra": {
        "hostname": "debianDesktop",
        "app": "Laravel",
        "env": "local"
    }
}
~~
All in all, instrumenting both metrics and logs are easy and only need to be done once and without touching the rest of your codebase. Thanks to OpenTelemetry automatic instrumentation, all requests are traced automatically.
Infrastructure
This section brings up the infrastructure needed to transport, store and visualise your observability data in your own computer.
Setting up the infrastructure locally manually is tedious so I highly recommend going the docker-compose route at https://codeberg.org/gmhafiz/observability. And if you do, at least read the #instrument section to familiarise yourself on how to instrument OpenTelemetry to a Laravel application.
The five main infrastructure we are going to bring up are:
- Loki for logs and Promtail for log pushing
- Jaeger for tracing
- Prometheus for metrics
- otel-collector to receive signals from application to backend
- Grafana for visualisation
Brave souls may continue to the next section.
Loki Logs
To push Laravel logs to a log aggregator like Loki, we include promtail in the root directory and have it run in the background. We only require one promtail binary and one configuration file for this.
Install both loki and promtail using your preferred method https://grafana.com/docs/loki/latest/setup/install/.
wget https://github.com/grafana/loki/releases/download/v3.2.1/loki-linux-amd64.zip
unzip loki-linux-amd64.zip
Create a loki config file loki-config.yaml and paste the following content.
# loki-config.yaml

auth_enabled: false

server:
  http_listen_port: 3100
  grpc_listen_port: 9096

limits_config:
    allow_structured_metadata: true

common:
  path_prefix: /tmp/loki
  storage:
    filesystem:
      chunks_directory: /tmp/loki/chunks
      rules_directory: /tmp/loki/rules
  replication_factor: 1
  ring:
    instance_addr: 127.0.0.1
    kvstore:
      store: inmemory

schema_config:
  configs:
    - from: 2024-06-01
      store: tsdb
      object_store: filesystem
      schema: v13
      index:
        prefix: index_
        period: 24h

ruler:
  alertmanager_url: http://localhost:9093

# By default, Loki will send anonymous, but uniquely-identifiable usage and configuration
# analytics to Grafana Labs. These statistics are sent to https://stats.grafana.org/
#
# Statistics help us better understand how Loki is used, and they show us performance
# levels for most users. This helps us prioritize features and documentation.
# For more information on what's sent, look at
# https://github.com/grafana/loki/blob/main/pkg/usagestats/stats.go
# Refer to the buildReport method to see what goes into a report.
#
# If you would like to disable reporting, uncomment the following lines:
#analytics:
#  reporting_enabled: false
Its config file in Loki version 3 requires schema version 13 using tsdb format. For demonstration and development purpose, we store the logs in local file system. But in a production setting, Loki recommends storing the logs in object storage such as AWS S3, Ceph or Minio. We expose two listening ports at 3100 and 9096 for http and grpc respectively. Lastly, if we choose to send logs to Loki through otlp, we need to allow structured metadata to be stored.
Run Loki with
./loki-linux-amd64 -config.file=loki-config.yaml
Check if your installation is successfully by querying its api and confirm if it returns a 200 OK response. It could take some time so let us proceed with promtail.
curl -v http://localhost:3100/ready
For promtail, I opt for single binary for linux:
wget https://github.com/grafana/loki/releases/download/v3.2.1/promtail-linux-amd64.zip
unzip promtail-linux-amd64.zip
In promtail, we need to tell it where your laravel logs are located, as well as where to forward them.
In its configuration file, the important bit is the list of jobs under ‘scrape_configs’. Here we name it as ’laravel-opentelemetry’ and we provide an absolute path to Laravel log, so adjust accordingly. In our case, it recursively reads all files that ends with ‘.log’ under Laravel ‘storage/log’. The place we are sending the logs is under ‘clients’ section which accepts an array. Here, we define Loki’s HTTP api address for log pushing. In our case, we only send it to one place which is our local loki installation but you could push it to more than one destination like Elasticsearch, Splunk, etc.
Open promtail-local.yaml and paste the following and change the path to your laravel’s log location.
# promtail-local.yaml

server:
  http_listen_port: 9080
  grpc_listen_port: 0
positions:
  filename: /tmp/promtail-positions.yaml
clients:
  - url: http://localhost:3100/loki/api/v1/push
scrape_configs:
  - job_name: laravel-opentelemetry
    static_configs:
      - targets:
          - localhost
        labels:
          job: laravel-opentelemetry
          __path__: /var/www/storage/logs/**/*.log # adjust to where you laravel directory is located
Run it with:
./promtail-linux-amd64 -config.file=promtail-local.yaml
Jaeger Tracing
Jaeger can also be run as a single binary. It is able to receive OTLP data through the port 4317 or 4318 but these conflicts with the same ports otel-collector we are going to run soon. So we set them to different ports instead.
wget https://github.com/jaegertracing/jaeger/releases/download/v1.63.0/jaeger-1.63.0-linux-amd64.tar.gz

tar -xzvf jaeger-1.63.0-linux-amd64.tar.gz

jaeger-1.63.0-linux-amd64/jaeger-all-in-one --collector.otlp.grpc.host-port :44317 --collector.otlp.http.host-port :44318
Note that all traces which are created will be lost when Jaeger is restarted because they are stored in memory. To keep the traces, configure a storage backend.
Prometheus Metrics
For simplicity sake, we run Prometheus as a docker container within host network. Before we run it, let us customise its configuration file.
We define only one scrape job. We give it a name, as well as how long we want it to wait between data scrapings.
‘static_configs’ accepts a list of addresses to be scrapped. Since we run laravel using php artisan serve, the address it exposes is http://localhost:8000. It is important to run this container in host network because Prometheus needs to be able to reach this localhost address. If ‘metrics_path’, if not defined, it will default to ‘/metrics’. So, we need to set it to ‘/api/metrics’ instead because that is the metric endpoint we exposed with Laravel.
# prometheus.yml

scrape_configs:
  - job_name: 'laravel'
    scrape_interval: 10s
    static_configs:
      - targets: ['localhost:8000']
    metrics_path: '/api/metrics'
Take this prometheus.yml config file and mount it into the container. Run the following command and Prometheus will run at its default port of 9090.
docker run \
  --name prometheus \
  --rm \
  --network=host \
  -v $HOME/Downloads/prometheus.yml:/etc/prometheus/prometheus.yml \
  -d \
  prom/prometheus:v3.0.0
Check if Prometheus API is running using curl and it should return a 200 OK status.
curl -v http://localhost:9090/-/healthy
We are choosing to store metrics data inside Redis. So if you have not got that yet, install valkey with the following command
docker run --name valkey --restart=always --publish 6379:6379 -d valkey/valkey:7.2
Otel-Collector
Both trace and log signals are funneled into otel-collector, a program that receives, process and export telemetry data. We do not strictly need this since telemetry signals can be exported directly from Laravel to Jaeger. The reason why we have this intermediary program are many. This program can scale independently of Laravel and Jaeger. It also includes features like batching, retries, filtering and more.
Interestingly, this is not the only otlp-compatible collector. For example, there is a contributor distribution based of otel-collector called otel-collector-contrib and another from Grafana called Alloy
Before running this program, let us take a look at its config file. It has four main sections namely ‘receivers’ to define how telemetry signals are received, ‘processors’ to perform batching, filtering, tries etc, ’exporters’ to define where we want to emit processed data to, and ‘service’ where we define data flow through pipelines.
Note that in the ‘service’ section, both ’traces’ and ’logs’ are defined but not ‘metrics’. This is because Prometheus is scraping data straight from Laravel, bypassing otel-collector. This brings us to a processor called ‘filter/ignore’. Since Prometheus scrapes the data every ten seconds, Laravel OpenTelemetry SDK will generate traces for it. You can filter that out based on the path.
# otel-collector-config.yaml

receivers:
  otlp:
    protocols:
      grpc:
        endpoint: localhost:4317
      http:
        endpoint: localhost:4318

exporters:
  debug:
    verbosity: detailed

  otlp:
    endpoint: localhost:44317 # because we mapped Jaeger otlp to this port
    tls:
      insecure: true
    retry_on_failure:
      enabled: true
    sending_queue:
      enabled: false

  otlphttp:
    endpoint: http://localhost:3100/otlp/v1/logs

processors:
  # https://github.com/open-telemetry/opentelemetry-collector/tree/main/processor
  batch:

  memory_limiter:
    limit_mib: 4000
    spike_limit_mib: 1000
    check_interval: 5s

  # https://github.com/open-telemetry/opentelemetry-collector-contrib/blob/main/processor/filterprocessor/README.md
  filter/ignore:
    traces:
      span:
        - attributes["http.route"] == "api/metrics"

extensions:
  health_check:
  pprof:
    endpoint: localhost:1888
  zpages:
    endpoint: localhost:55679

service:
  extensions: [pprof, zpages, health_check]
  pipelines:
    traces:
      receivers: [otlp]
      processors: [batch, memory_limiter, filter/ignore]
      exporters: [debug, otlp]
    logs:
      receivers: [otlp]
      processors: [batch, memory_limiter]
      exporters: [debug, otlphttp]
Run otel-collector-contrib with
docker run \
  -v $HOME/Downloads/otel-collector-config.yaml:/etc/otelcol-contrib/config.yaml \
  --name otel-collector \
  --network=host \
  -d \
   otel/opentelemetry-collector-contrib:0.114.0
Grafana
Grafana can be used to visualise all OpenTelemetry signals that we have. To install, I will show the apt way because why not.
sudo apt install -y apt-transport-https software-properties-common
sudo mkdir -p /etc/apt/keyrings/
wget -q -O - https://apt.grafana.com/gpg.key | gpg --dearmor | sudo tee /etc/apt/keyrings/grafana.gpg > /dev/null
echo "deb [signed-by=/etc/apt/keyrings/grafana.gpg] https://apt.grafana.com stable main" | sudo tee -a /etc/apt/sources.list.d/grafana.list
sudo apt update && sudo apt install grafana
sudo systemctl daemon-reload && sudo systemctl start grafana-server && sudo systemctl enable grafana-server
Explore Grafana Dashboard
Now that we have infrastructure up and Laravel instrumented, it is time to explore what insights we can gain from these signals.
Logs
Open Grafana at http://localhost:3000 and login as admin/admin. To add Loki as Grafana data source, under ‘Connections’, click on the ‘Data sources’ link in the side menu.

Find Loki in the list

The only setting you need to put is Loki’s endpoint which is http://localhost:3100

Scroll down and click the “Save & test button” to verify connectivity.

To view the logs, either click on the ‘Explore view’ link or go to ‘Explore’ menu and select Loki from the dropdown box.

To filter only Laravel logs, select from these two dropdown boxes, click ‘Run query’ button and voila, you see a stream of laravel logs complete with its trace ID!

Grafana has a nice query builder form to help search and filter you want. If you prefer typing Loki’s query language (LogQL) instead, simply switch to ‘Code’. The equivalent query to fetch all laravel logs is {job="laravel-opentelemetry"}.

If we know what trace ID we are interested in, we can simply search for that string. Here I am using LogQL and Loki filters the two logs with that trace ID.

Tracing
Once run, add Jaeger as Grafana data source just like we did with Loki

The address to Jaeger is http://localhost:16686, hit ‘Save & test’ button, and explore view.
Once you are in Jaeger explore view, there is a dropdown box under ‘Search’ query type where you can filter by ’laravel’. Sometimes it does not appear on first time view and I have to refresh the whole page before Grafana can detect a new ’laravel’ trace service.

Click ‘Run query’ button and you will see a list of traces for all laravel api you have done within the time period.

Click on any one of them and you will see detailed trace information along with any spans if they exist. The OpenTelemetry PHP SDK instruments database queries so you are able to see its queries and how long it took.
In the detailed view, we can see the whole request-response took about 45 milliseconds. The SQL query was started at around 16 millisecond and took the majority of time at 28 milliseconds.

Remember that we logged the random number inside UserController.php? That log line is also included in the span. If you click on the first span named ’laravel GET /api/users’, the log information is stored under resource events.

Metrics
This brings us to the final observability signal which is metrics and we are going to see some cool line charts. I will show how histogram we created gives us useful insights on how /api/users perform and its count. To view this metric, go to Grafana at http://localhost:3000 and select Prometheus as data source. The address is simpley http://localhost:9090

Initially you won’t be able to see any metric data for /api/users endpoint until you have run it at least once. Making one request is fine, but it is better to simulate real-world traffic so we can perform basic traffic analysis. To this end, let us generate some synthetic load using k6.
Load testing with k6
Before we run any load testing, ensure that a single request works.
curl -v http://localhost:8000/api/users
If everything looks alright, install k6 and set an instruction file. There are a total of eight virtual users (vus) with three stages. Each stage has a pre-defined number of vus. So this will complete in ten minutes.
import http from 'k6/http';

export const options = {
    vus: 8,

   stages: [
       { duration: '2m', target: 4 }, // traffic ramp-up from 1 to N users over X minutes.
       { duration: '6m', target: 8 }, // stay at N users for X minute
       { duration: '2m', target: 0 }, // ramp-down to 0 users
   ],
};

export default function () {
    http.get('http://localhost:8000/api/users');
}
Save it as load-test.js and run with
k6 run load-test.js
k6 will return a result that looks like this.
          /\      |‾‾| /‾‾/   /‾‾/
     /\  /  \     |  |/  /   /  /
    /  \/    \    |     (   /   ‾‾\
   /          \   |  |\  \ |  (‾)  |
  / __________ \  |__| \__\ \_____/ .io

     execution: local
        script: load-test.js
        output: -

     scenarios: (100.00%) 1 scenario, 8 max VUs, 40s max duration (incl. graceful stop):
              * default: 8 looping VUs for 10s (gracefulStop: 30s)


     data_received..................: 780 kB 74 kB/s
     data_sent......................: 14 kB  1.4 kB/s
     http_req_blocked...............: avg=145.12µs min=86.44µs med=116.41µs max=599.83µs p(90)=171.83µs p(95)=509.15µs
     http_req_connecting............: avg=72.76µs  min=47.73µs med=66.18µs  max=145.46µs p(90)=97.45µs  p(95)=111.22µs
     http_req_duration..............: avg=509.18ms min=68.18ms med=515.53ms max=572.06ms p(90)=544.65ms p(95)=547.53ms
       { expected_response:true }...: avg=509.18ms min=68.18ms med=515.53ms max=572.06ms p(90)=544.65ms p(95)=547.53ms
     http_req_failed................: 0.00%  ✓ 0         ✗ 161
     http_req_receiving.............: avg=29.02ms  min=27.19ms med=28.5ms   max=39.1ms   p(90)=30.95ms  p(95)=32.04ms
     http_req_sending...............: avg=38.61µs  min=19.88µs med=35.32µs  max=421.94µs p(90)=49.54µs  p(95)=57.4µs
     http_req_tls_handshaking.......: avg=0s       min=0s      med=0s       max=0s       p(90)=0s       p(95)=0s
     http_req_waiting...............: avg=480.12ms min=39.6ms  med=486.88ms max=543.81ms p(90)=514.34ms p(95)=518.02ms
     http_reqs......................: 161    15.349624/s
     iteration_duration.............: avg=509.42ms min=69.14ms med=515.72ms max=572.31ms p(90)=544.86ms p(95)=547.8ms
     iterations.....................: 161    15.349624/s
     vus............................: 8      min=8       max=8
     vus_max........................: 8      min=8       max=8
Ensure no request has failed by checking http_req_failed. The two most important metric are iteration_duration and iterations that give latency and throughput respectively.
Let us return to Prometheus.
Latency traffic analysis using metrics
Just like tracing, the metric can be selected using Grafana form builder. Search for the name of our histogram, http_server_duration and you should see three metrics with the unit we defined, in milliseconds which were created automatically.
Starting with ‘count’, it is a counter so it can be used to find how many times this endpoint are hit. ‘Sum’ is the total of time unit, in our case, milliseconds, our endpoint has been spent on. This is used to find endpoint latency. This brings us to ‘bucket’ which gives us a fine-grained latency data of each API endpoint grouped by its latency buckets.

The first metric we want to craft is latency. The total duration is stored in ‘sum’ metric. To calculate latency, we divide the rate of duration(sum) over the rate of how many times this /api/users endpoint has been visited. Thus our PromQL is as follows.
rate(http_server_duration_milliseconds_sum{exported_job="Laravel"} [$__rate_interval])
/
rate(http_server_duration_milliseconds_count{exported_job="Laravel"} [$__rate_interval])
The above PromQL looks like a normal math formula with a nominator and a denominator. The [$__rate_interval] is a special Grafana variable that guarantees to be at least four times the scrape interval. We also constrained our metric of choice to be ‘Laravel’ for ’exported job’ key.
The resulting line chart is as follows. X-axis is the time while Y-axis gives us the latency in milliseconds. Notice that latency grew towards the end as our load tester increases the number of concurrent users.

Service Level Objective of /api/users must be below 40ms 95% of time
Let’s say that we have a requirement saying GET /api/users endpoint needs to be below 40 milliseconds 95% of the time. We don’t have a bucket defined at 40 milliseconds so let us fudge by using the 32 milliseconds bucket instead. That means we need to find the proportion of request latency below that value over all requests. To find the proportion, we simply select buckets which are less than or equal (le) 32 milliseconds and divide over the whole requests i.e http_server_duration_milliseconds_bucket{exported_job="Laravel",le="32"} / http_server_duration_milliseconds_bucket{exported_job="Laravel",le="+Inf"}. The function increase() calculates the rate of increase over one minutes sliding average while sum() sums up all the values. The numerator is multiplied by 100 to give a nice value of 100%. The whole numerator part is divided of all requests by using +Inf bucket. The resulting PromQL is as follows.
sum(
  increase(http_server_duration_milliseconds_bucket{exported_job="Laravel",le="32"}[1m])
) * 100 /
sum(
  increase(http_server_duration_milliseconds_bucket{exported_job="Laravel",le="+Inf"}[1m])
)

Popular endpoints per day
Finding out popular endpoints can give an indication of frequently visited pages. The histogram we made also counted the frequency so let us see how we can craft a PromQL to obtain this information.
We can reuse the counter created automatically with our histogram. I am not sure if this is the best metric to be used because we could have created a specific counter metric for this. Nevertheless, we apply increase() function to the http_server_duration_milliseconds_count metric to calculate the increase in counter of this time-series on a specific range. This range is a special Grafana variable in which you can adjust using the controller in the top right. Then sum() is applied and you should get about the same value as the number of requests k6 has made.
sum(increase(http_server_duration_milliseconds_count{exported_job="Laravel"}[$__range]))
As you can see, a simple histogram that we have is powerful and PromQL is very flexible.
Epilogue
While this blog post is rather long, auto instrumenting with OpenTelemetry is actually quite easy. Just have the OpenTelemetry PHP extension installed, add some composer packages, and enable it in environment setting and you are all done. Same goes with logs which are picked up automatically although the way I am choosing is different as I have another process that picks them up, and that brought additional modification as I want to have trace ID correlation. Metrics cannot be done through OpenTelemetry because of the storage issue but Prometheus is mature enough to be used on its own.
Initial time investment to observability looked complicated but each of metrics, tracing, and logs only need to be instrumented once. Arguments can be made regarding nesting tracing because each new child function isn’t automatically traced so you have to add the code manually.
There isn’t much changed to Laravel 11 apart from the new way to register service providers and file locations were moved around. I have been playing around with this OpenTelemetry SDK and promphp library since March and compatibility wise, it is fine. It used to be harder with fragmented opentracing libraries so I am glad OpenTelemetry has unified all these signals into stable SDKs.
What’s Next
What is not demonstrated in this post is OpenTelemetry instrumentation is also able to trace request along with its background jobs. This is a powerful tool to have because without it, you can easily lose context when you have thousands of background jobs and not knowing from which request it came from. This is done by adding trace context in the job handler and when the job is picked up, that context will be extracted and thus, the same parent trace is reused.
Talking about observability is not complete if we do not touch upon distributed tracing. In the diagram below, we have a SpringBoot api that call the Laravel api server, and in turn calls a Go api to return some data.

When each of these services are instrumented the same way, the same trace ID is used in all three services and as a result we get a nice graph showing exactly how the call flows. Both tracing background job and distributed tracing code are in the repository.
Another potent advantage to OpenTelemetry is the ability to correlate data between the three signals. In the sample repository, there is an ability to jump from a log straight to a trace using ‘derived field’ with a click of a button. This is possible because both share the same unique trace ID.
There you have it. If you made this this far, thank you for reading. Please check out my other blog posts too!
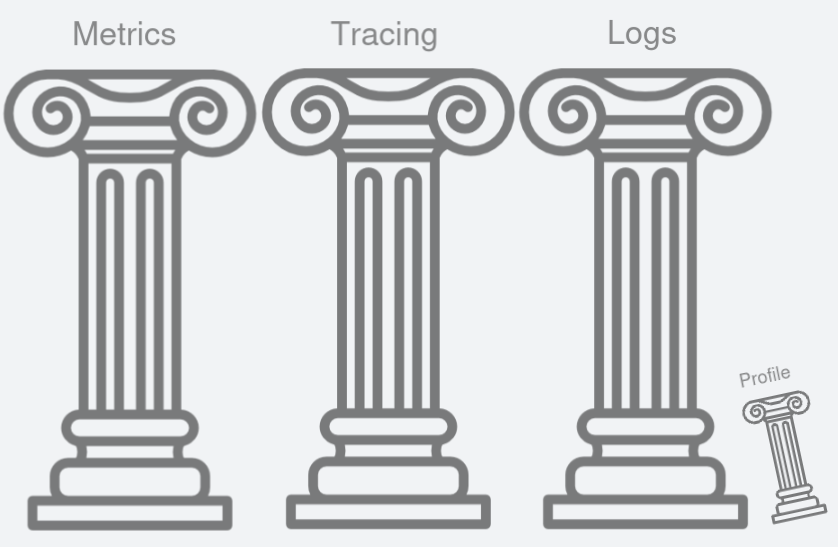
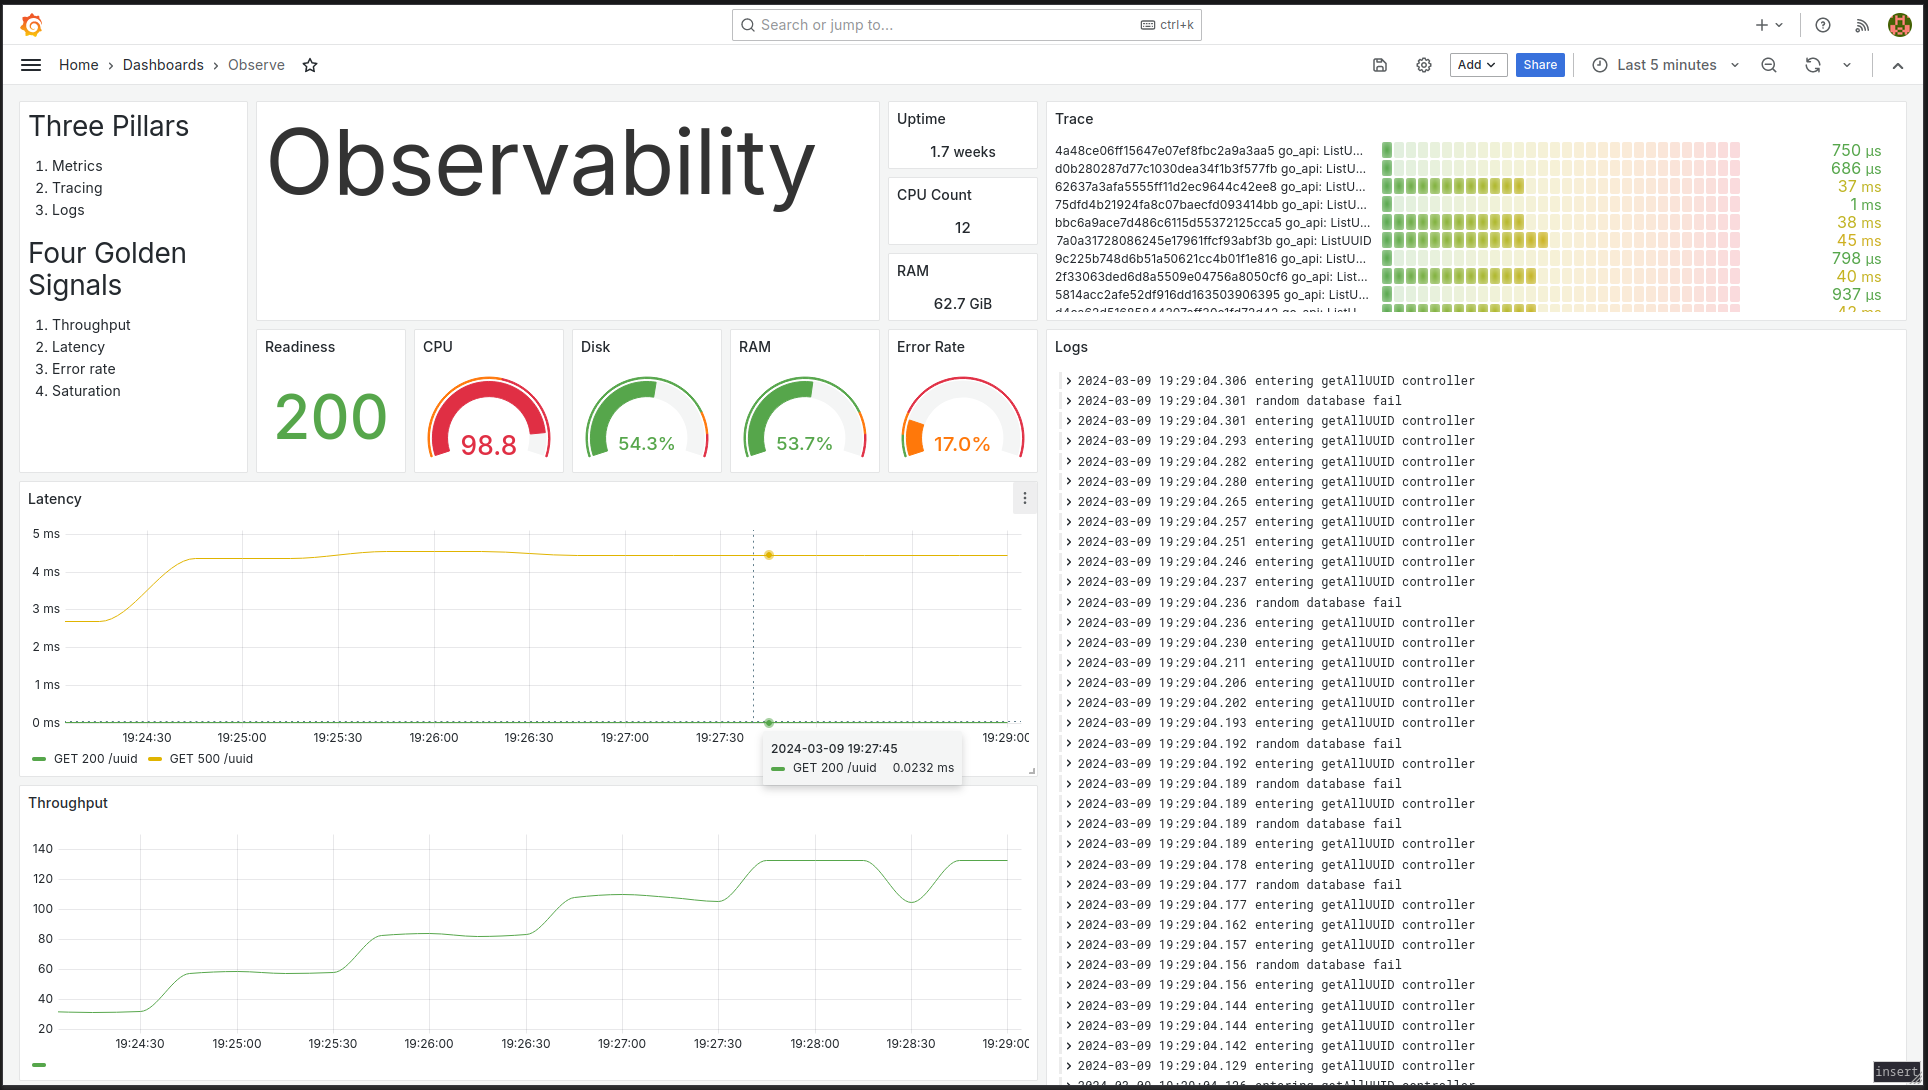 Figure 2: Single pane of view to observability.
 Figure 3: Have you ever missed the error lines you are interested with in spite of your shell script skills?
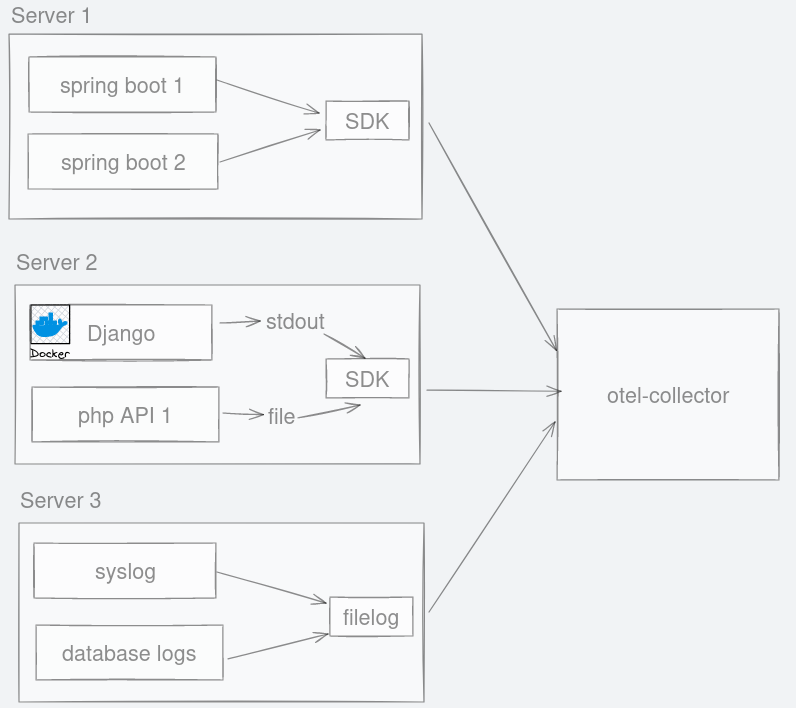 Figure 4: No matter where logs are emitted, they can be channelled to otel-collector.
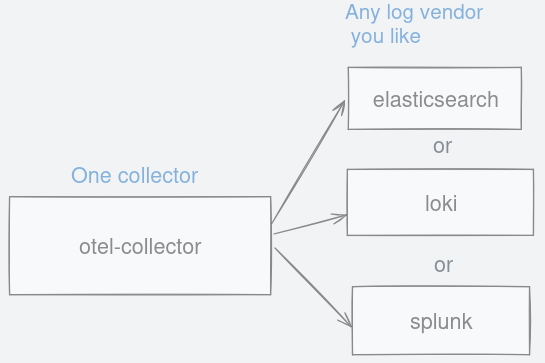 Figure 5: Choose between any logging backend you like as long as they support otlp format.
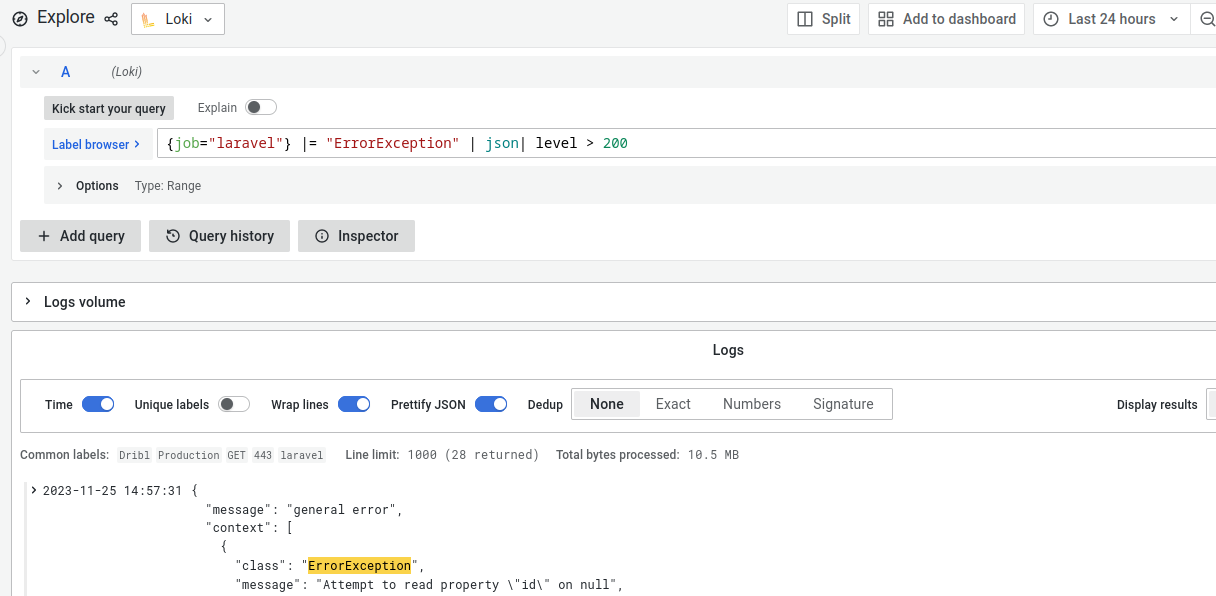 Figure 6: Great user interface that allows searching using a readable query language.
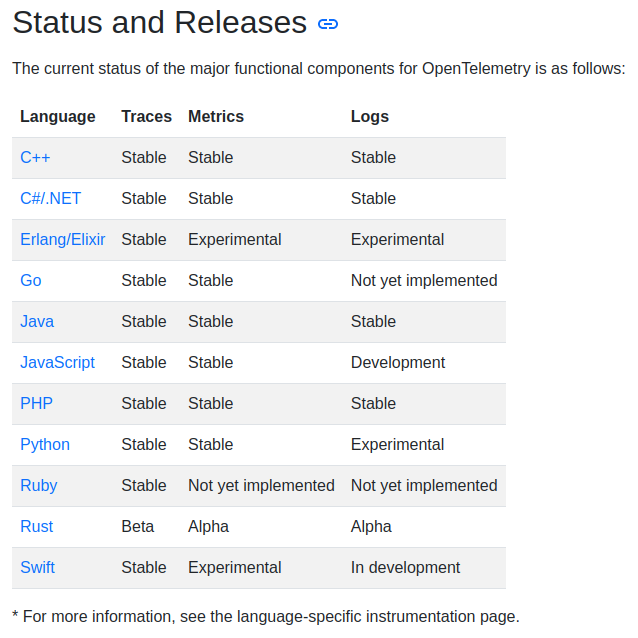 Figure 7:
 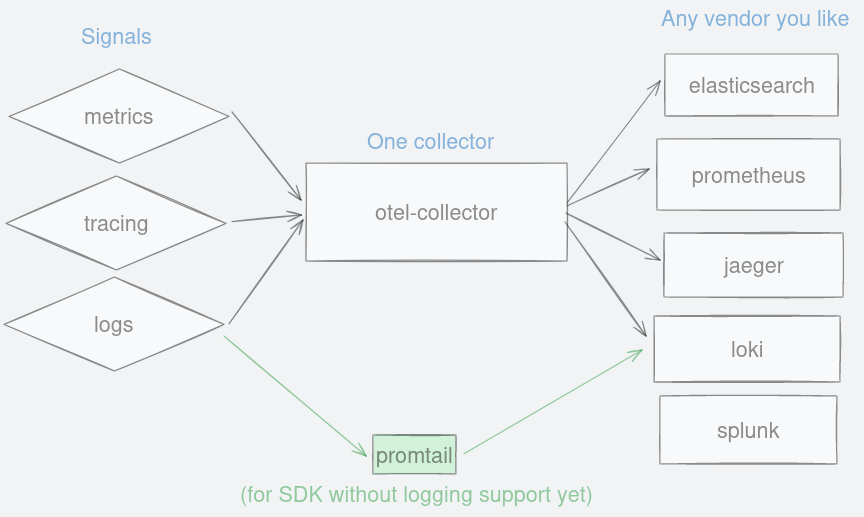 Figure 8: Alternative pathway for pushing logs into your backend using promtail.
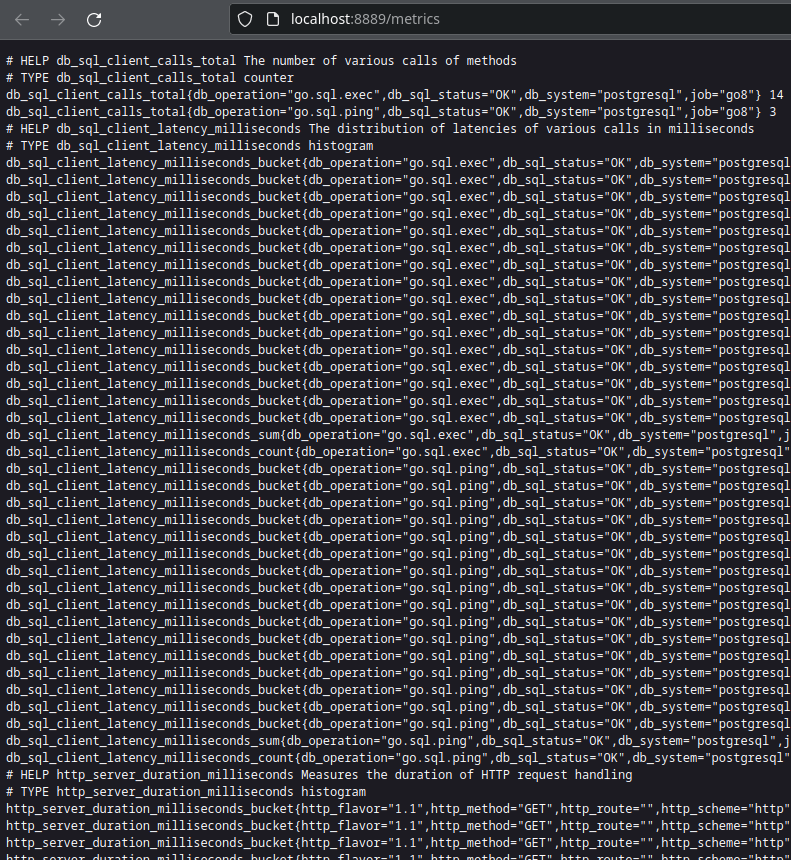 Figure 9: Raw metrics data collected by otel-collector.
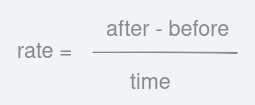 Figure 10: Formula to finding out the rate is simply the delta over time.
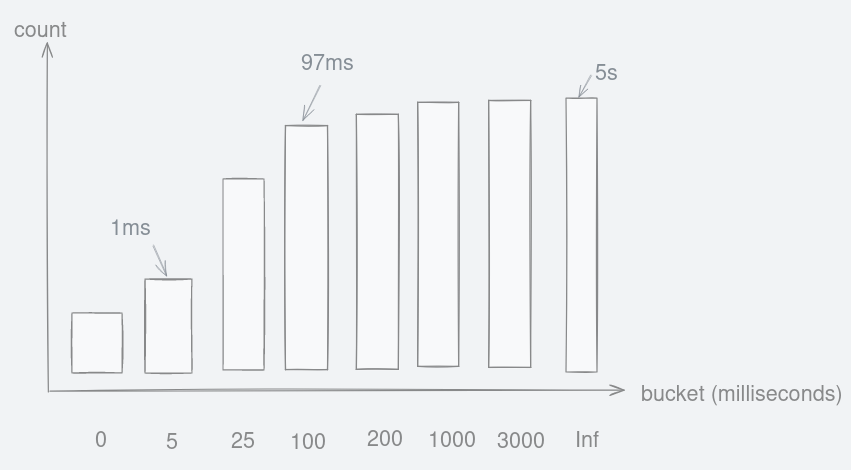 Figure 11: Hypothetical cumulative histogram that stores request duration into buckets.
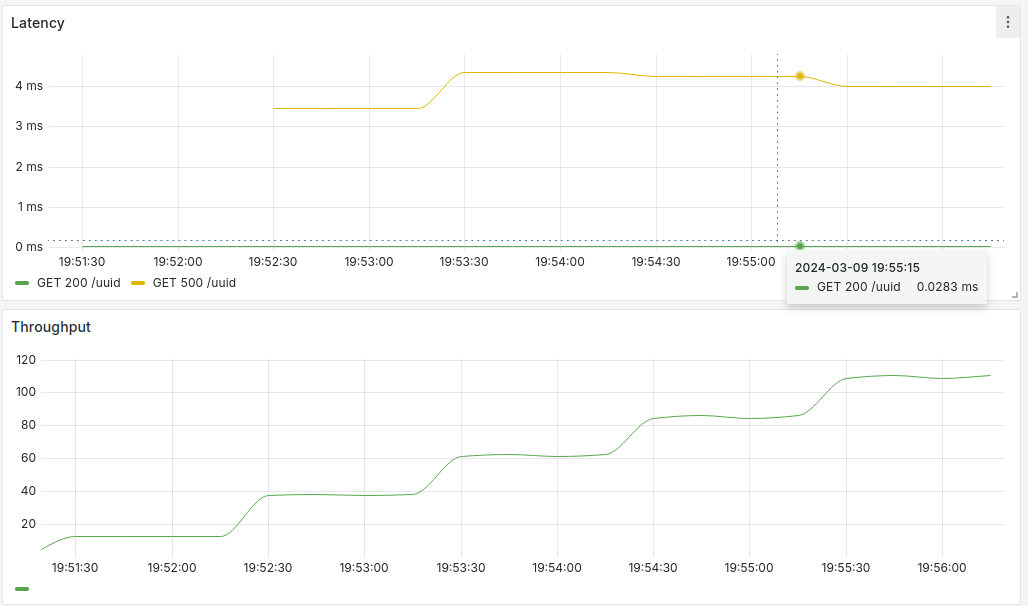 Figure 12: Line charts showing latency and throughput for /uuid endpoint.
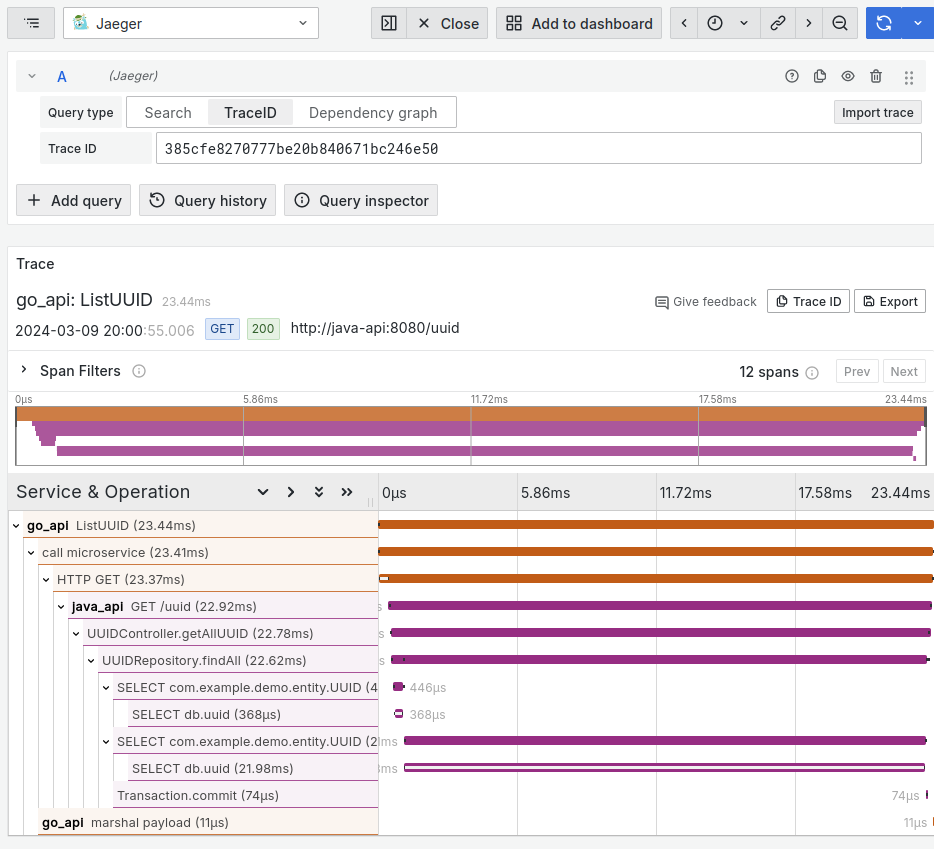 Figure 13: Name and duration of twelve spans for this single trace of this request.
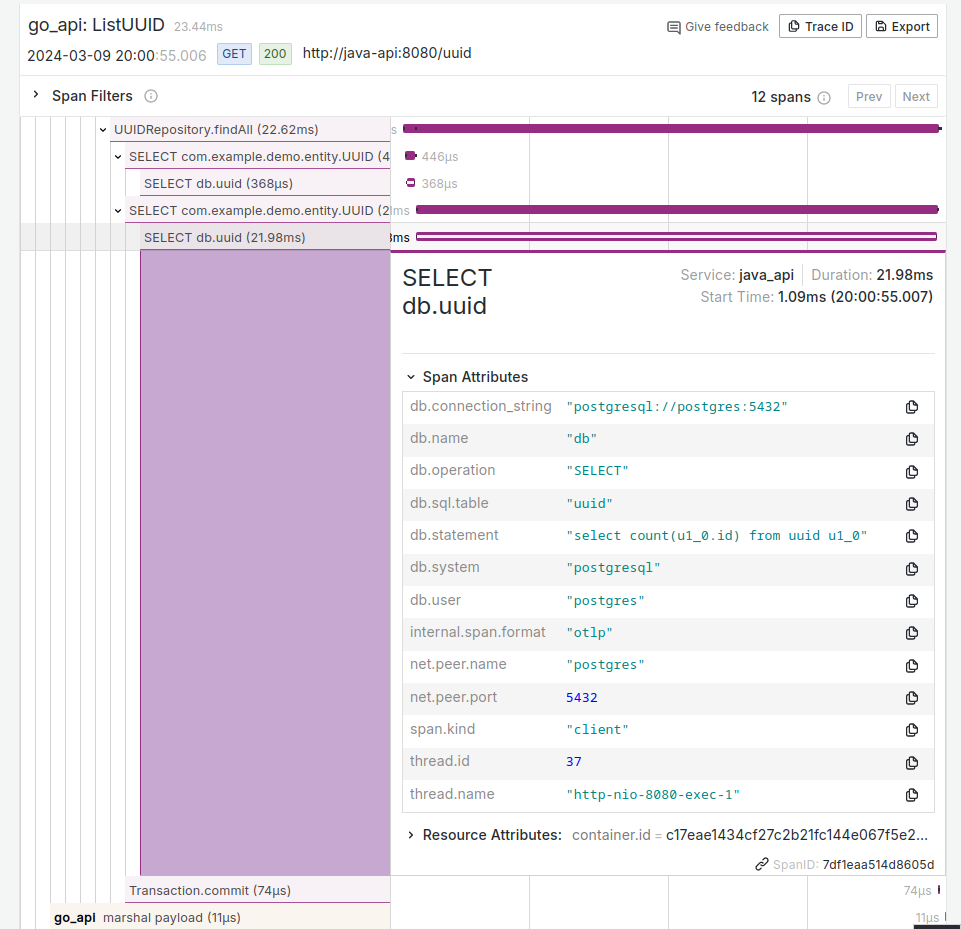 Figure 14: Each span can be clicked to reveal more information.
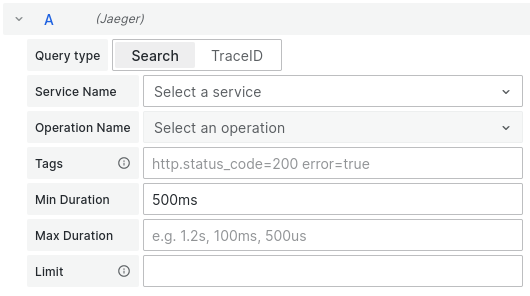 Figure 15: Spans can be filtered to your criteria.
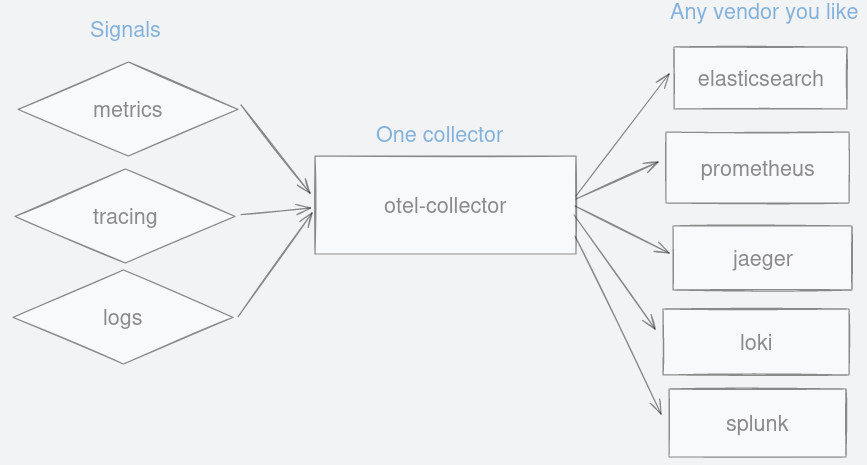 Figure 16: A single collector to forward observability signals to any vendor you like.
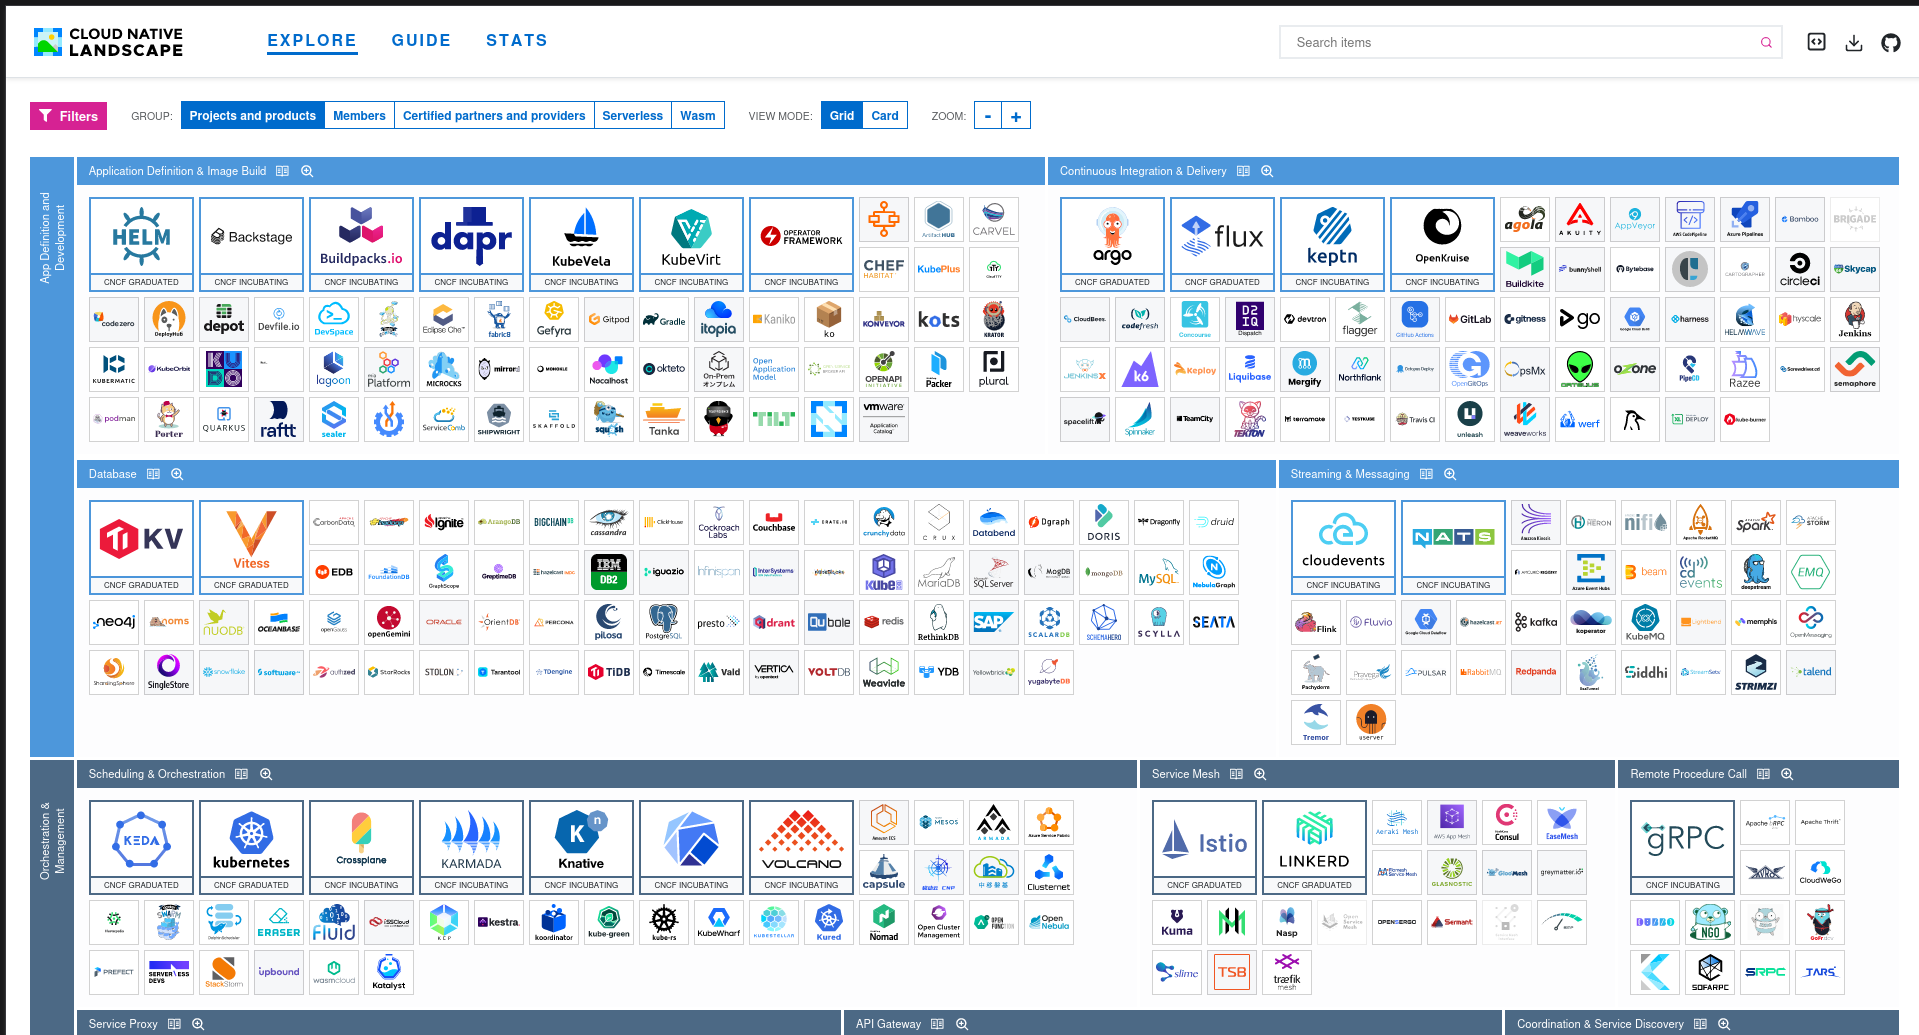 Figure 17: OpenTelemetry belongs to CNCF.